
Thesis
In 1987, the launch of PeopleSoft, a client-server human resource management system (HRMS) marked a watershed moment for HR software, sparking the creation of a multi-billion-dollar industry. Until PeopleSoft, organizations relied on large, centralized mainframe computers to handle their computing needs for HR-related activities. While powerful, these mainframes were expensive and often required dedicated IT staff and infrastructure to maintain.
With the introduction of Enterprise Resource Planning (ERP) systems in the 1990s, distributed software platforms integrated HR with various functions, from operations to finance, into a unified platform. These integrations allowed organizations to break down data silos and create a flow of information across different departments. For HR, this meant that processes such as payroll, benefits administration, and personnel tracking could be managed within the same system as other core business operations.
HR software continued to see growing adoption in the late 2010s and early 2020s, catalyzed by the rise of remote and distributed work in the wake of the COVID-19 pandemic. The HR software market was valued at $9.6 billion in 2022 and was projected to grow at a 6.5% CAGR to reach $18.6 billion by 2032. Driving this growth is not only increased demand to more efficiently manage human resources across growing complexity but also improving technology that allows for better automation and integration of data sources across an organization.
ChartHop pulls together disparate data sources via integrations with company-wide systems such as payroll to help companies unlock previously hidden insights. By connecting previously siloed data sources in real-time, companies can map out the future of their organization and adapt to changing circumstances. As a result, instead of having to create pivot tables in Excel, executives can use ChartHop to map out the impact of proposed headcount changes across their whole organization, shifting HR software to focus on real-time data and company-wide insights.
Founding Story

Source: ChartHop
ChartHop was founded in 2018 by Ian White (CEO/CTO). After graduating from Brown University with a degree in Computer Science, White worked as a developer at several companies before becoming Business Insider’s first Head of Engineering in 2008, where he worked until 2010 after which he transitioned to an advisory role.
In 2010, White then founded Sailthru, an email personalization platform that grew to be used for sending 10 billion emails per month. It was able to achieve $20 million in revenue within its first three years, making Sailthru the 29th fastest-growing company on the Inc. 5000 list. Yet, even as Sailthru grew, its early HR processes started to break down, providing White with a key insight:
“We had good software tools for every aspect of the business — except the people side. For some reason, people software is a backwater and everybody resorts to spreadsheets for anything serious. After I left Sailthru, I consulted with a number of organizations, big and small. I saw the same org management issues pop up again and again. The challenges we faced at Sailthru weren’t unique — they’re actually quite prevalent for every operating leader.”
Instead of using static spreadsheets for organizational management that end up being used once a year, White, therefore, had an idea for a new goal to build software that could “turn an organization into code”, enabling leaders to visualize and model organizational changes and addressing some of the challenges he had experienced at Sailthru. After spending two years building the initial product, White began fundraising, leading to ChartHop’s initial $5 million seed round in 2020. ChartHop has since expanded beyond people analytics, covering everything from compensation reviews to recruiter experiences.
Product
ChartHop is a people operations platform that acts as a single source of truth to unify an organization’s data on its workforce The platform centralizes data across HR and tech stacks by connecting key systems like an organization’s applicant tracking system (ATS) to compensation and performance data.
People Analytics
Source: ChartHop
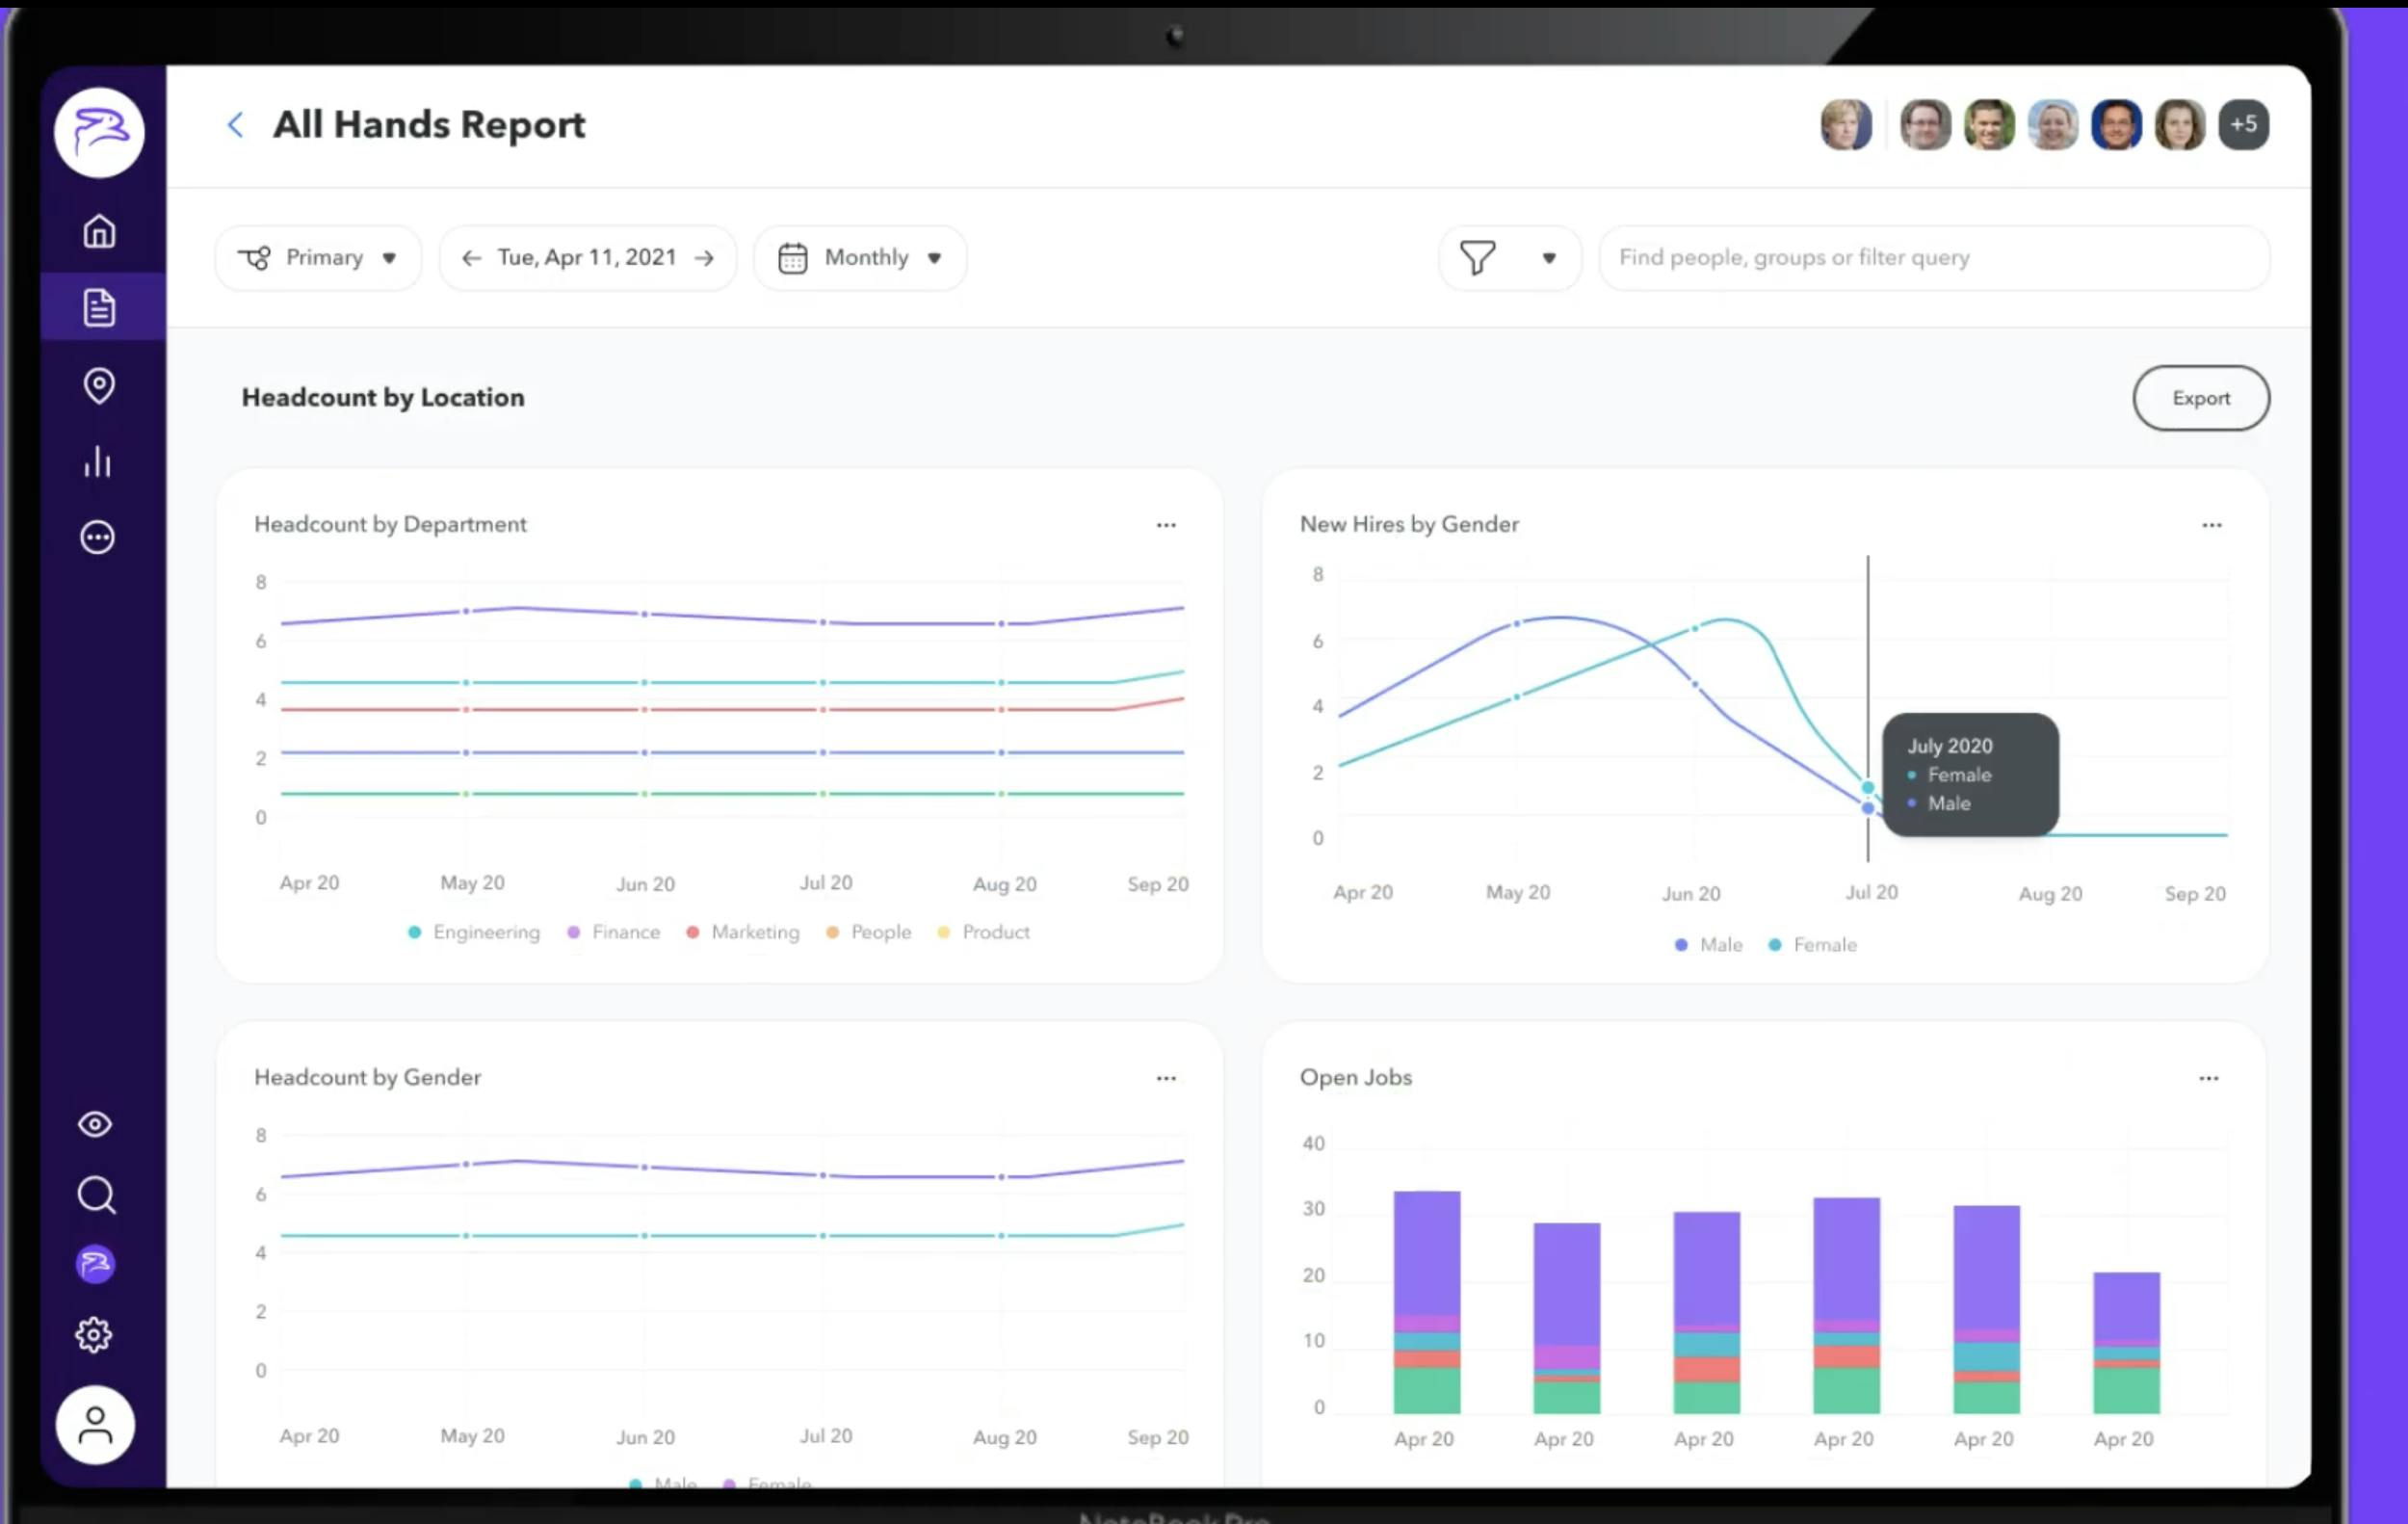
ChartHop’s People Analytics product creates a centralized place for aggregating people data and analysis. Through ChartHops integrations, it aggregates an organization's people data across multiple data sources to extract key insights and analytics. For example, companies can integrate their human resources information system (HRIS), applicant tracking system (ATS), payroll software, identity management software, and more with ChartHop.
From these integrations, ChartHop makes data more accessible. For example, if a company stored employees’ base pay in its payroll system, bonuses in a spreadsheet, and equity grants in Carta, it would not have a complete picture of how its employees are being compensated. As a result, it would be unable to analyze how compensation varies between departments, levels, and geographies. ChartHop unifies this data into an interactive dashboard to allow companies to compare metrics such as performance ratings with variables like compensation.
Further, ChartHop updates dynamically; no pull requests or manual data updates are required. Instead, data syncs automatically via ChartHop’s integrations, so reports are up-to-date. Given this, users can access real-time data, enabling them to alter decisions based on their changing organizational structure.
Org Chart
Source: ChartHop
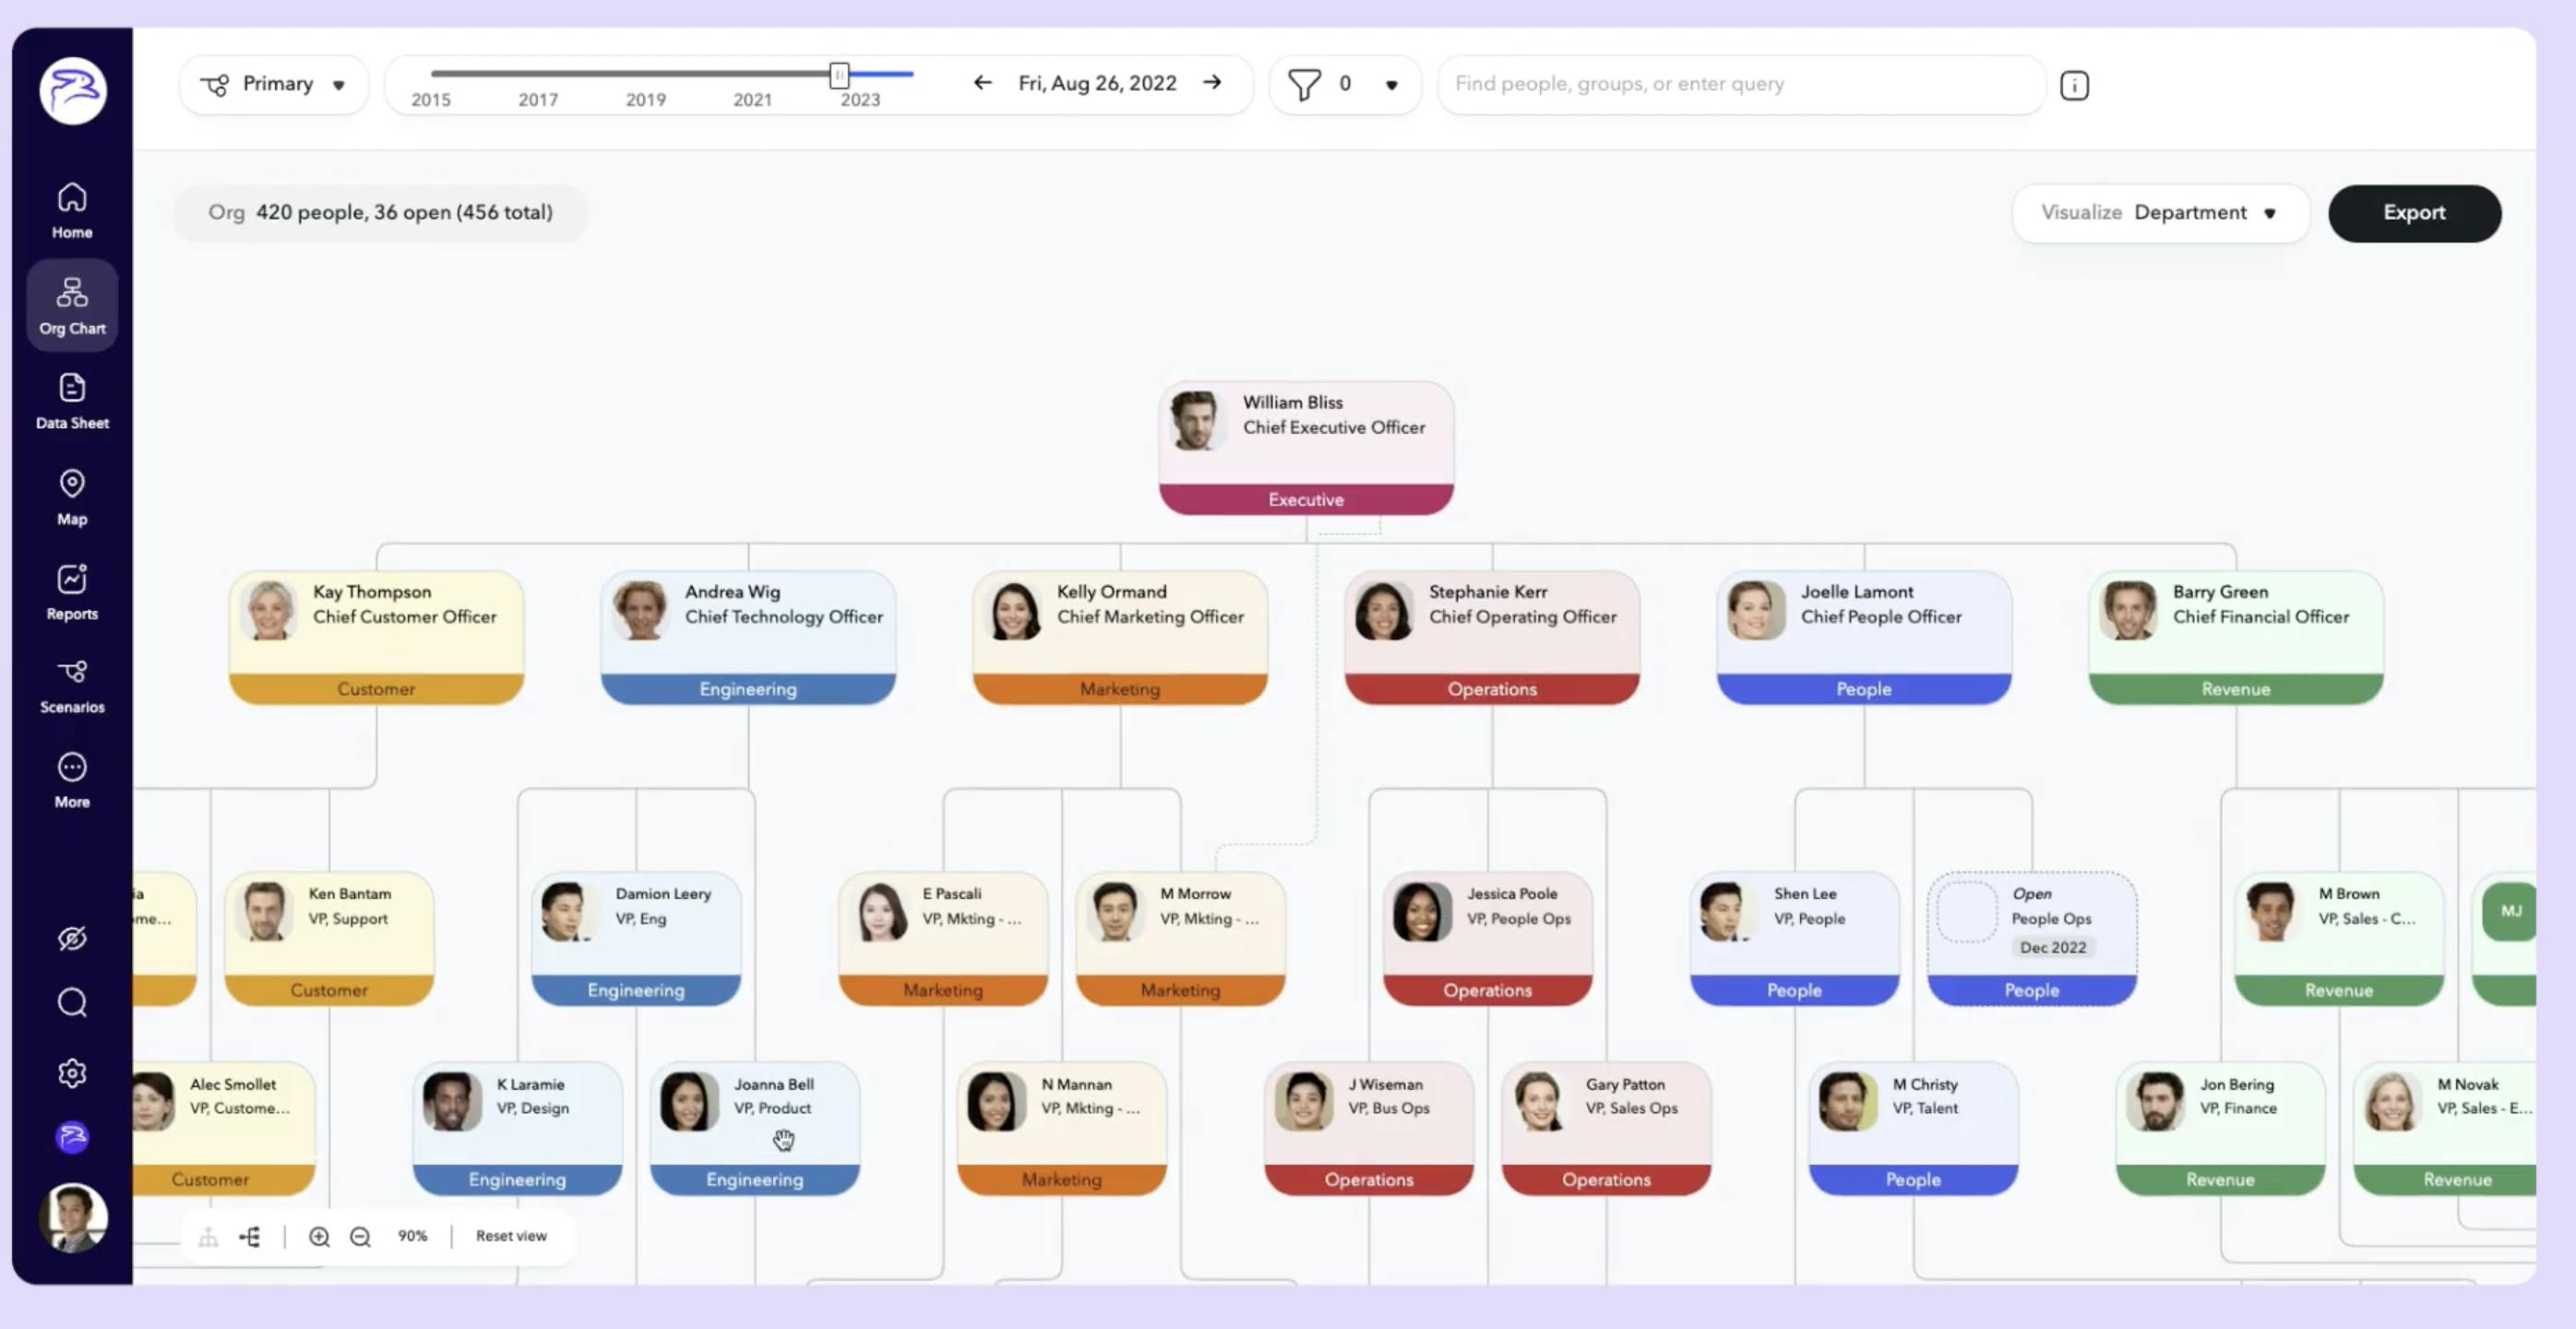
Alongside providing data analytics, ChartHop enables organizations to create org charts that automatically update. These charts can include personal details like employee location, hobbies, and other characteristics enabling company leaders to gain a holistic overview of their employee base. The charts leverage ChartHop’s integrations with payroll data and ATS systems to also show open roles and provide a visual of a company’s team structure.
Like most of its features, ChartHop’s org charts support revision control, thus letting companies view how their org chart has changed over time, as well as plan for future changes. For example, companies can link their org chart to their ATS and forecast how new roles will impact the balance of their existing team. ChartHop also enables scenario planning, so companies can compare the cost and impact of proposed headcount and raise plans by simulating scenarios. Since all of this data is accessible company-wide, recruiters can also leverage it to know exactly what departments to begin hiring for and to automatically update open jobs with new hire details.
Source: ChartHop
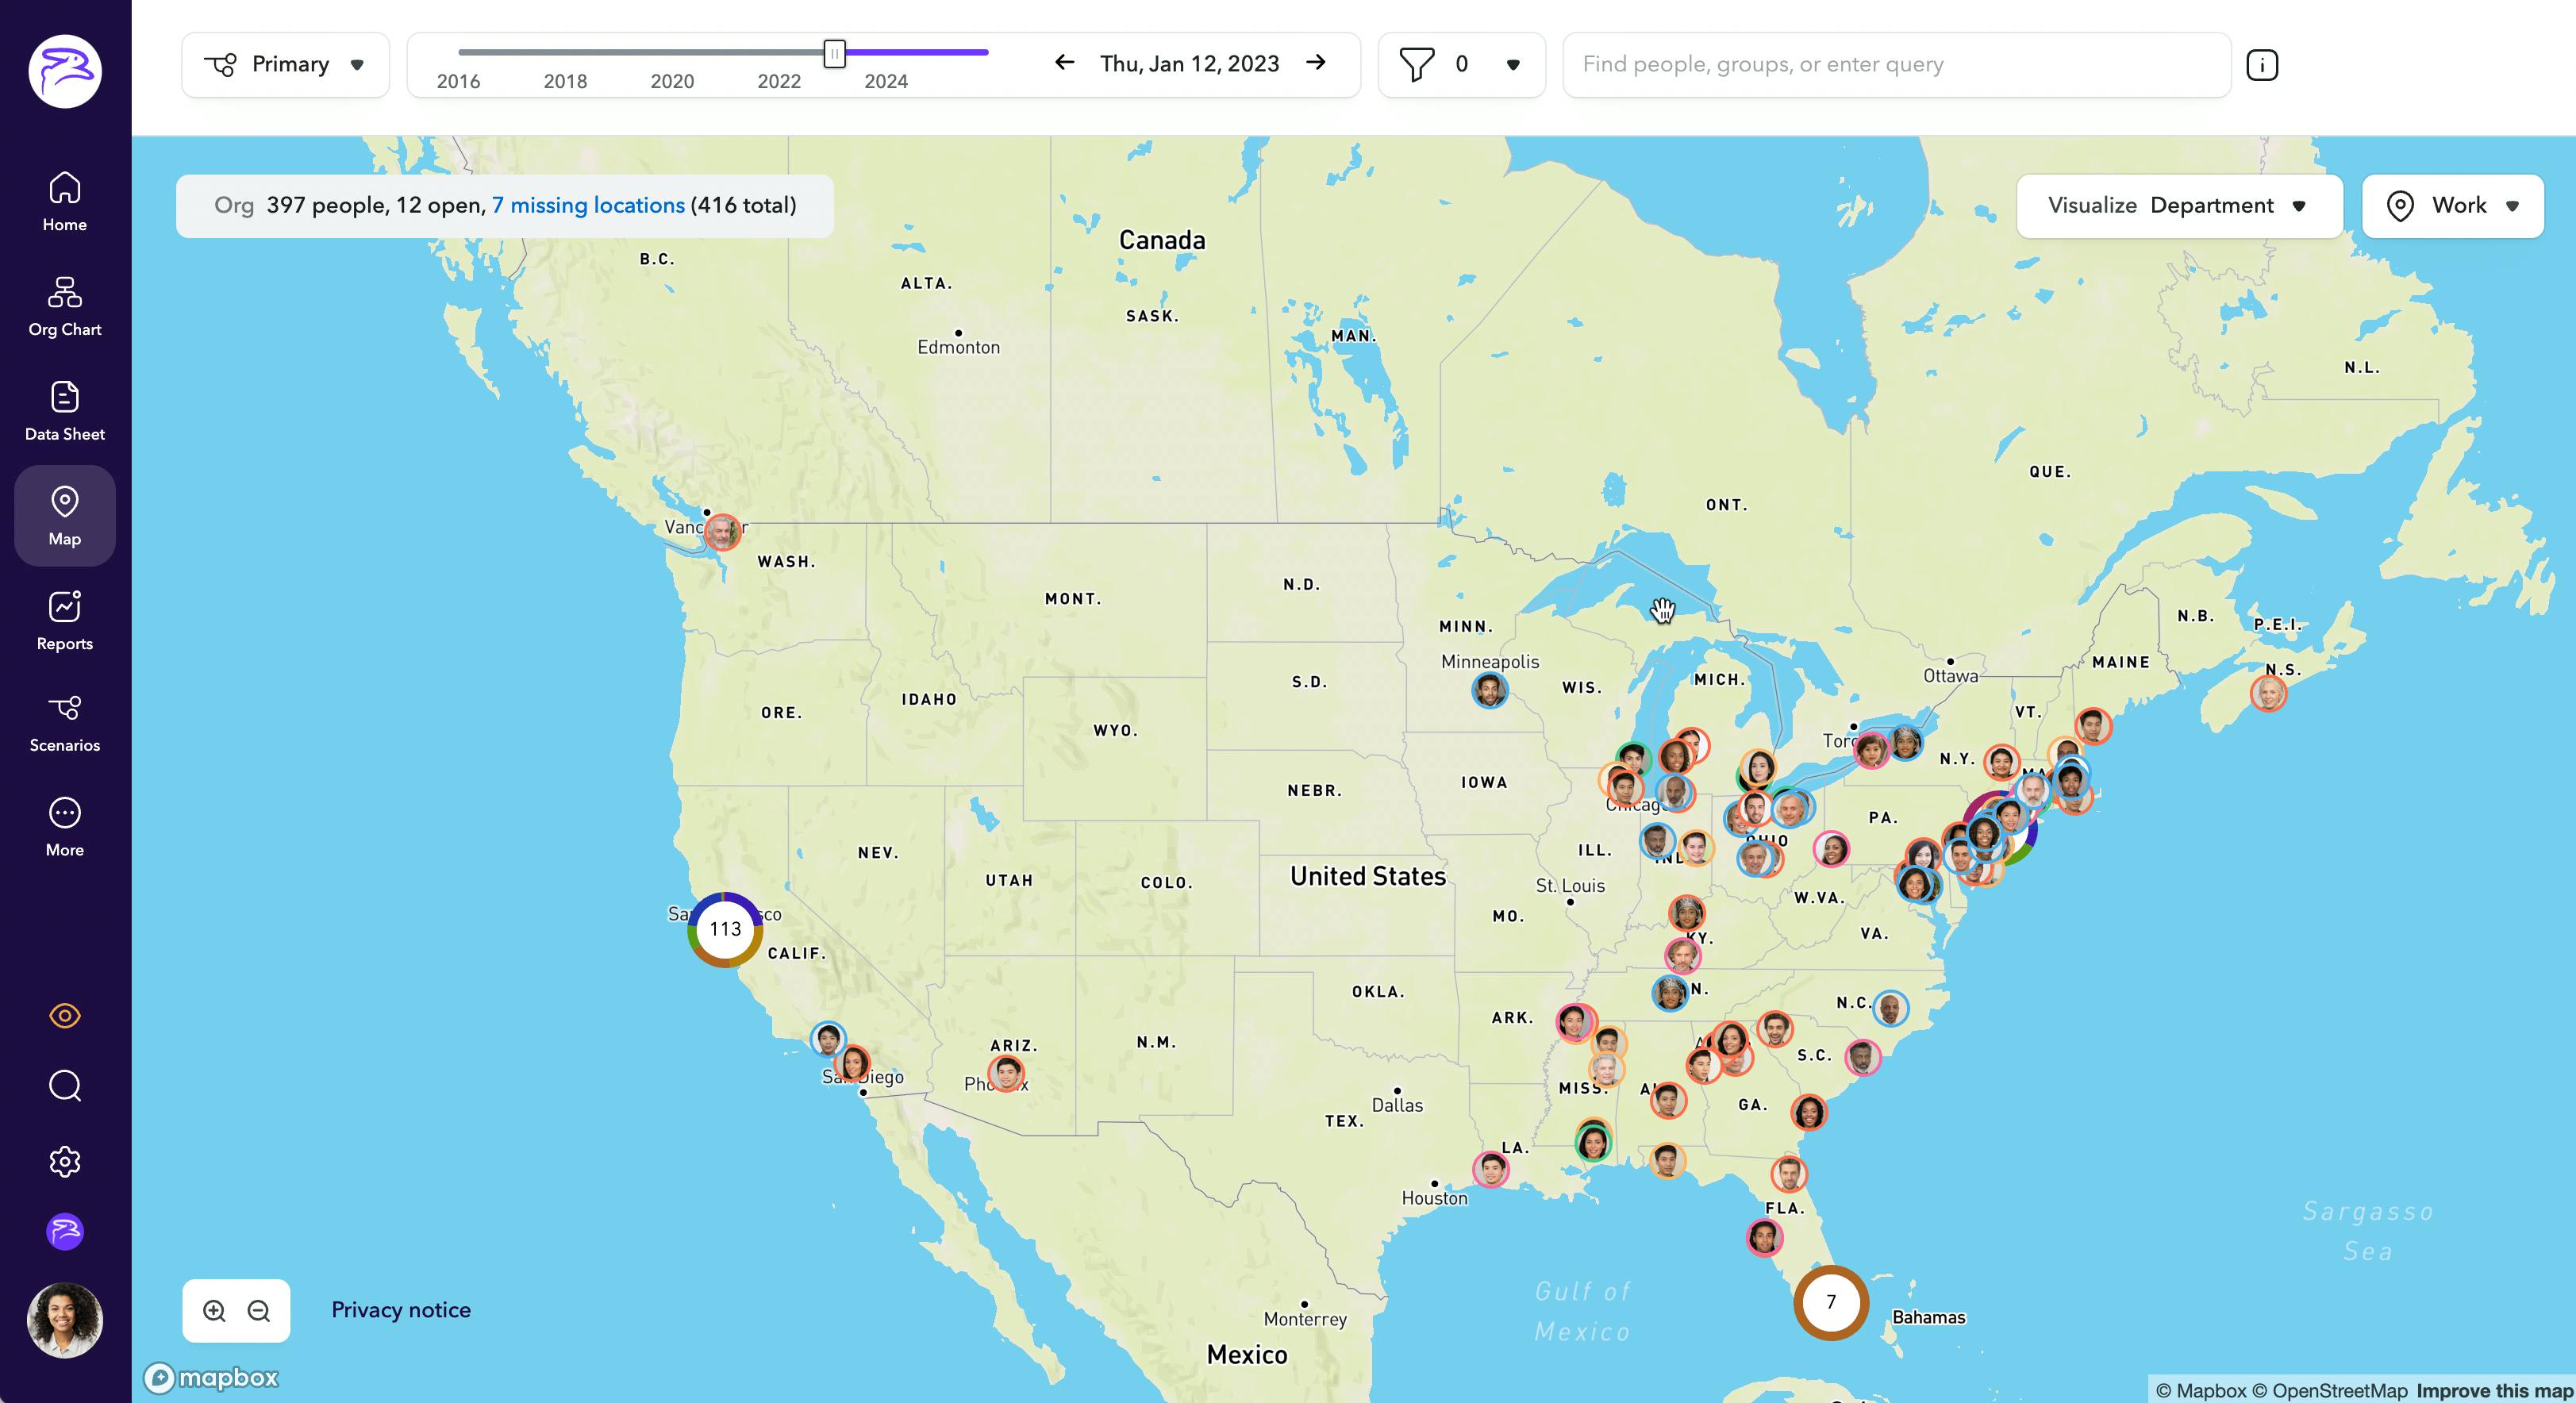
In addition to org charts, companies can also view their employee base on a global map to visualize their company. When paired with filters, recruiting leaders can analyze the spread of specific departments around the world to forecast where future hiring efforts may be needed. To this end, the map view enables remote-first companies to accurately track where their employees are based as they scale, helping companies increase employee engagement by planning in-person events and retreats.
Headcount Planning
Source: ChartHop
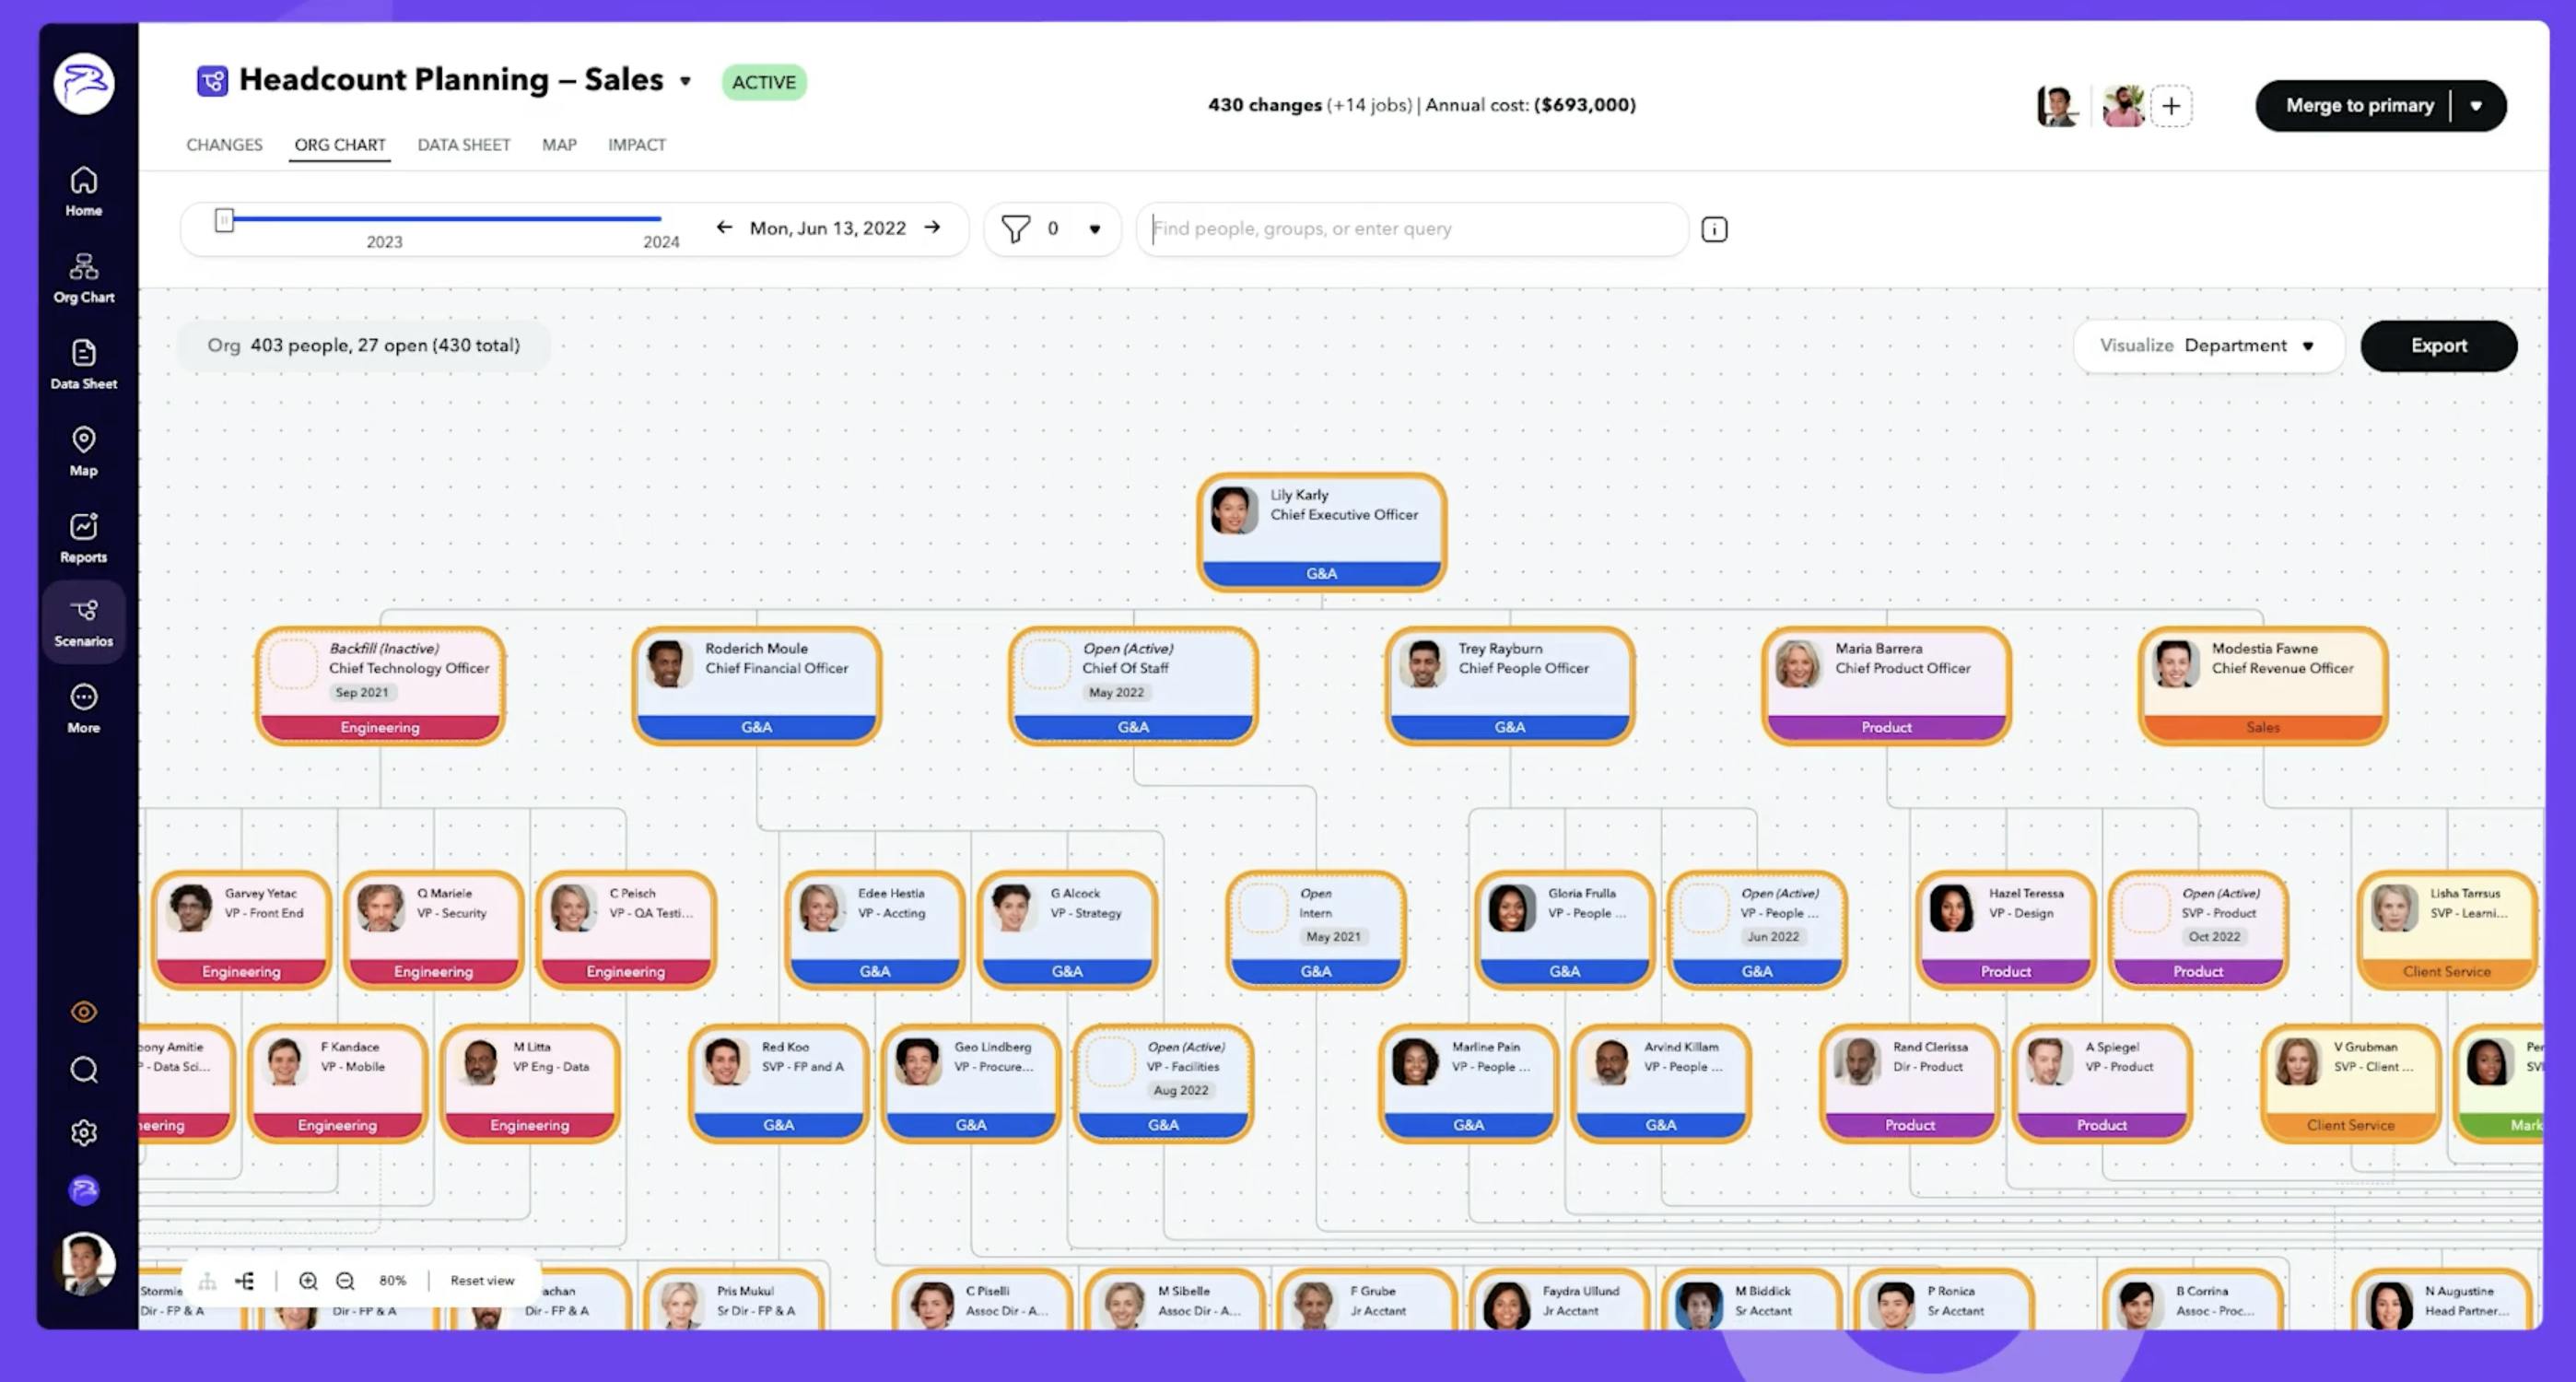
ChartHop's Headcount Planning tool is meant to enable teams to streamline planning as they scale. It allows managers, executives, HR, and finance to align on headcount plans as they scale without having to rely on multiple separate spreadsheets being used by each hiring manager to create and manage their own hiring plans.
Using the Headcount Planning tool, HR teams or leaders within the org can create individual scenarios for hiring. This begins with ChartHop’s Org Charts which visually displays the organization and any relevant people data.
For example, if a leader wanted to expand the headcount on their team for the new year, they would have an access-controlled part of the Org Chart that only shows what information they’re allowed to see, such as performance data, compensation, and last raise, to enable data-driven headcount plans.
This would enable them to propose promotions based on performance data with a few clicks, change employees’ titles or comp bands, or make salary or equity adjustments to existing employees. It can also be used to change the reporting structure of an org and add headcount to report to an existing manager. Once a scenario has been designed, it can then be shared with collaborators who can then review the plan, make adjustments, and leave comments. Once complete, the scenario can be enacted via ChartHop’s integrations to the company’s ATS and HRIS.
Engagement
Source: ChartHop
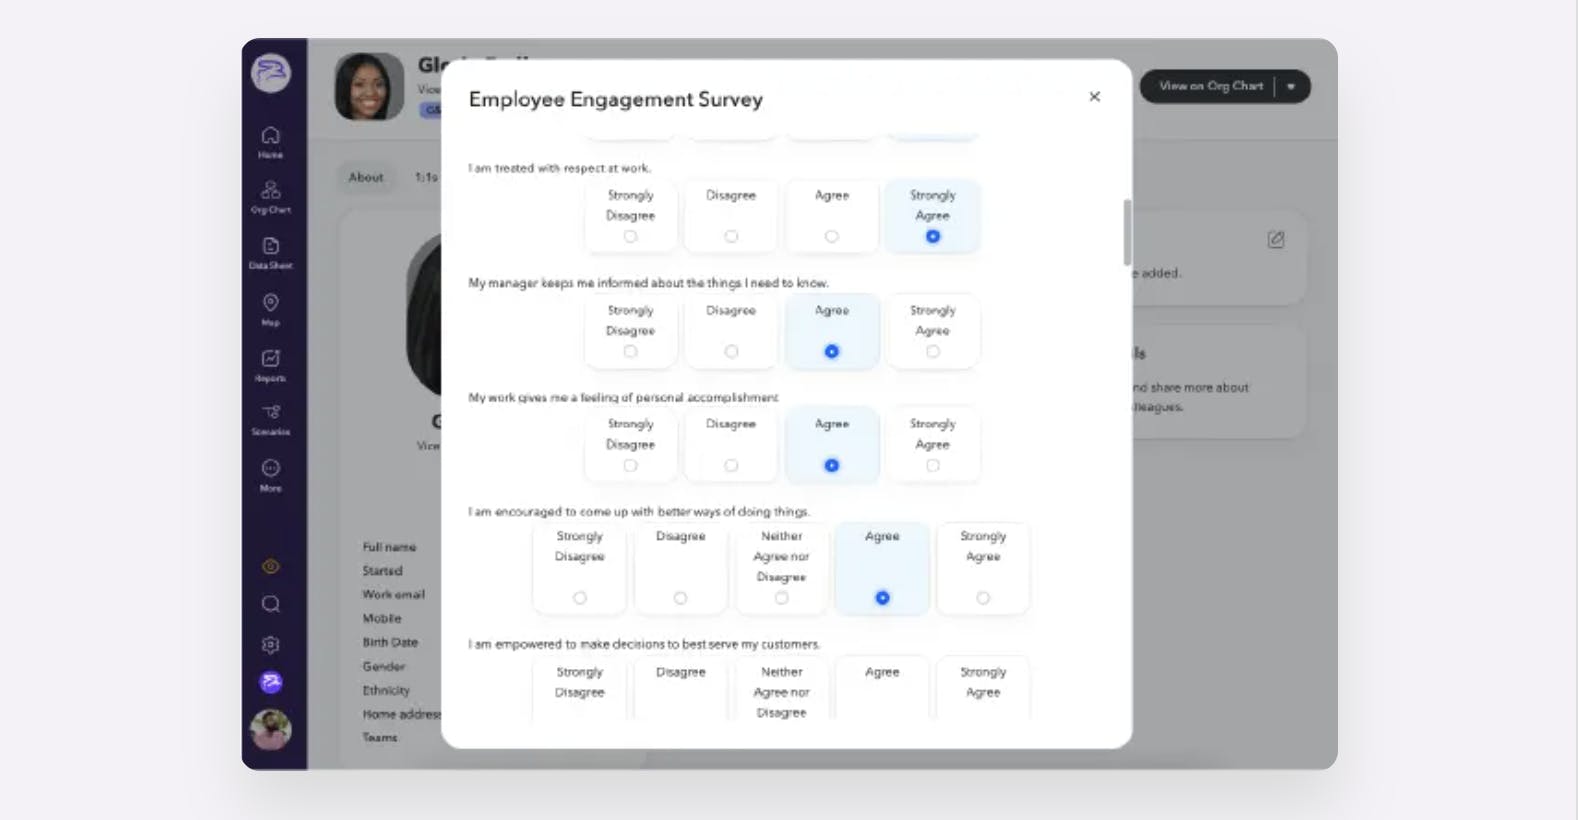
ChartHop’s Engagement product enables companies to conduct employee engagement surveys and 1:1 employee feedback forms. The product is intended to be used for ad-hoc employee feedback that may take place outside of quarterly or annual performance cycles, to more easily gauge employee sentiment across a workforce, and to measure employee engagement data quantitatively. Survey results can be displayed in a real-time dashboard. The goal is to reduce the friction of managing feedback and to enable the promotion of a culture of feedback.
Compensation Reviews
Source: ChartHop
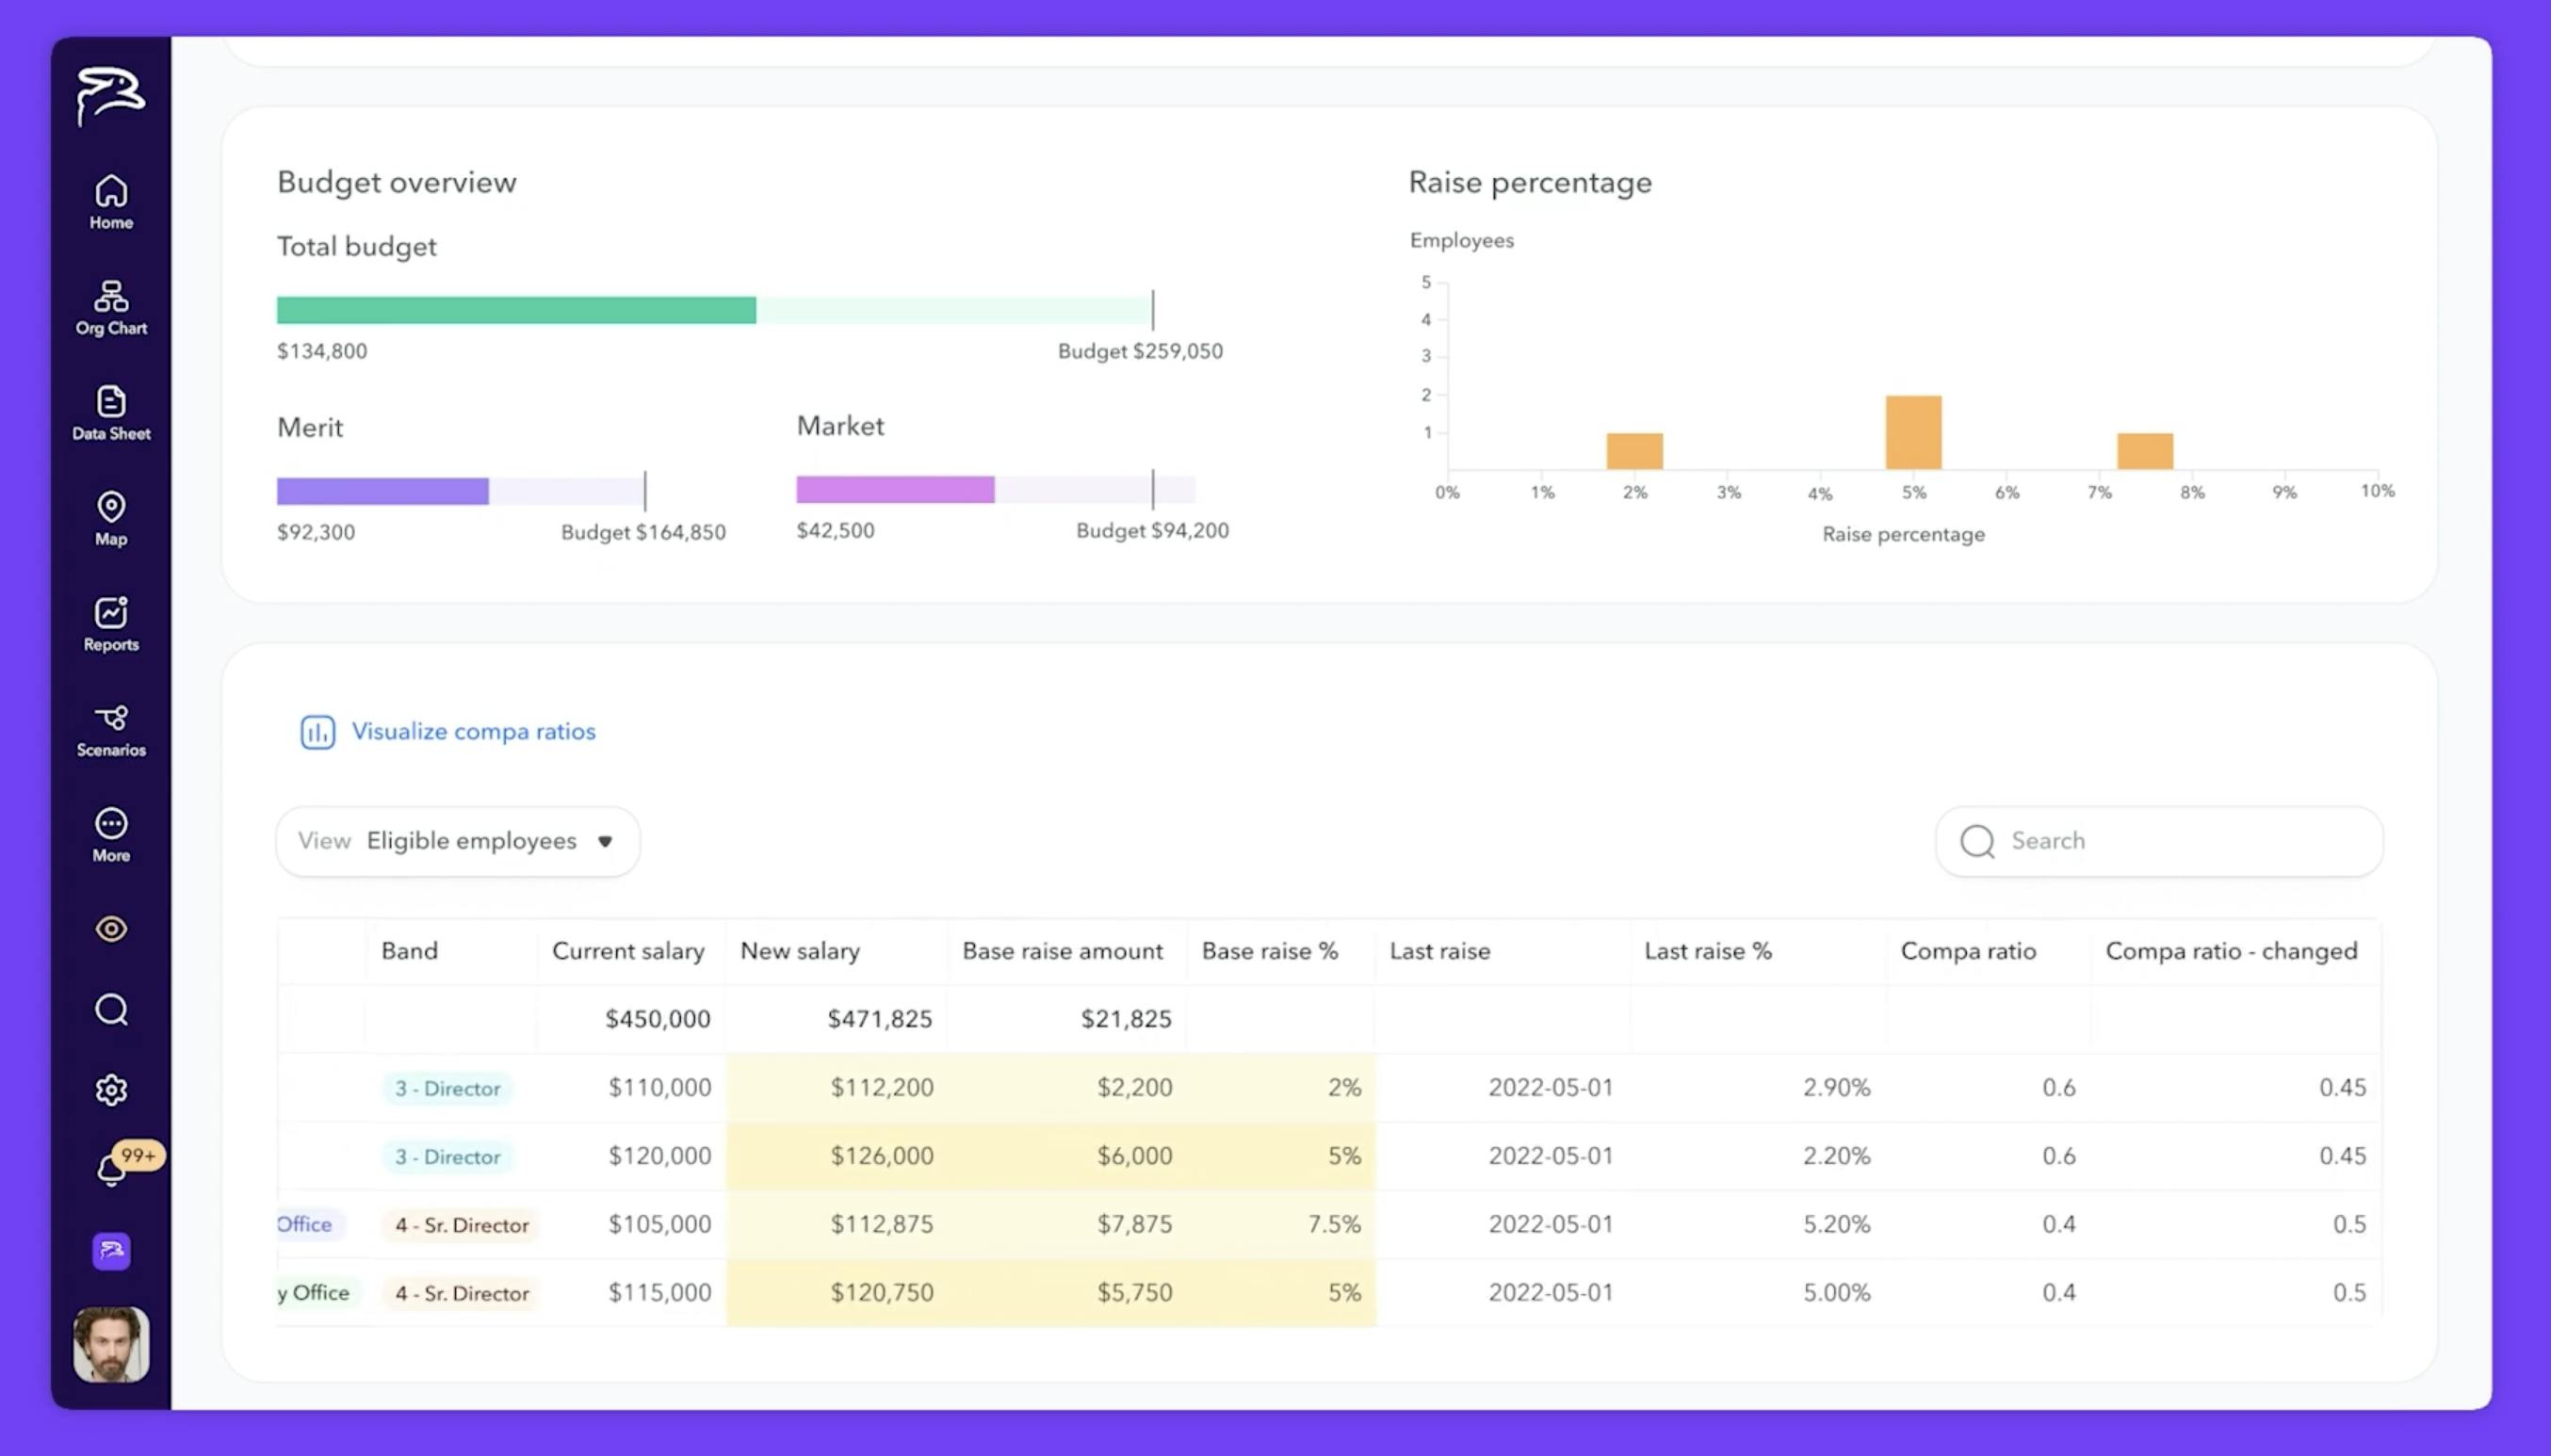
With ChartHop’s access to company-wide data, it is able to help managers plan merit raises by providing an overview of performance ratings, equity, compensation, salary history, bands, and more. This is intended to reduce bias in compensation, and also to ensure that employees who are potentially being unfairly compensated can be flagged, reducing the likelihood of employee churn.
With compensation reviews, companies can create approval workflows, distribute manager workbooks, and sync data with their financial planning and analysis (FP&A) systems, such as Workday Adaptive Planning, to collaborate with finance teams on compensation plans. Further, companies can leverage the data that ChartHop has to streamline their performance reviews by actively tracking key data points regarding employee performance, compensation, work history, and more.
Integrations
Source: ChartHop
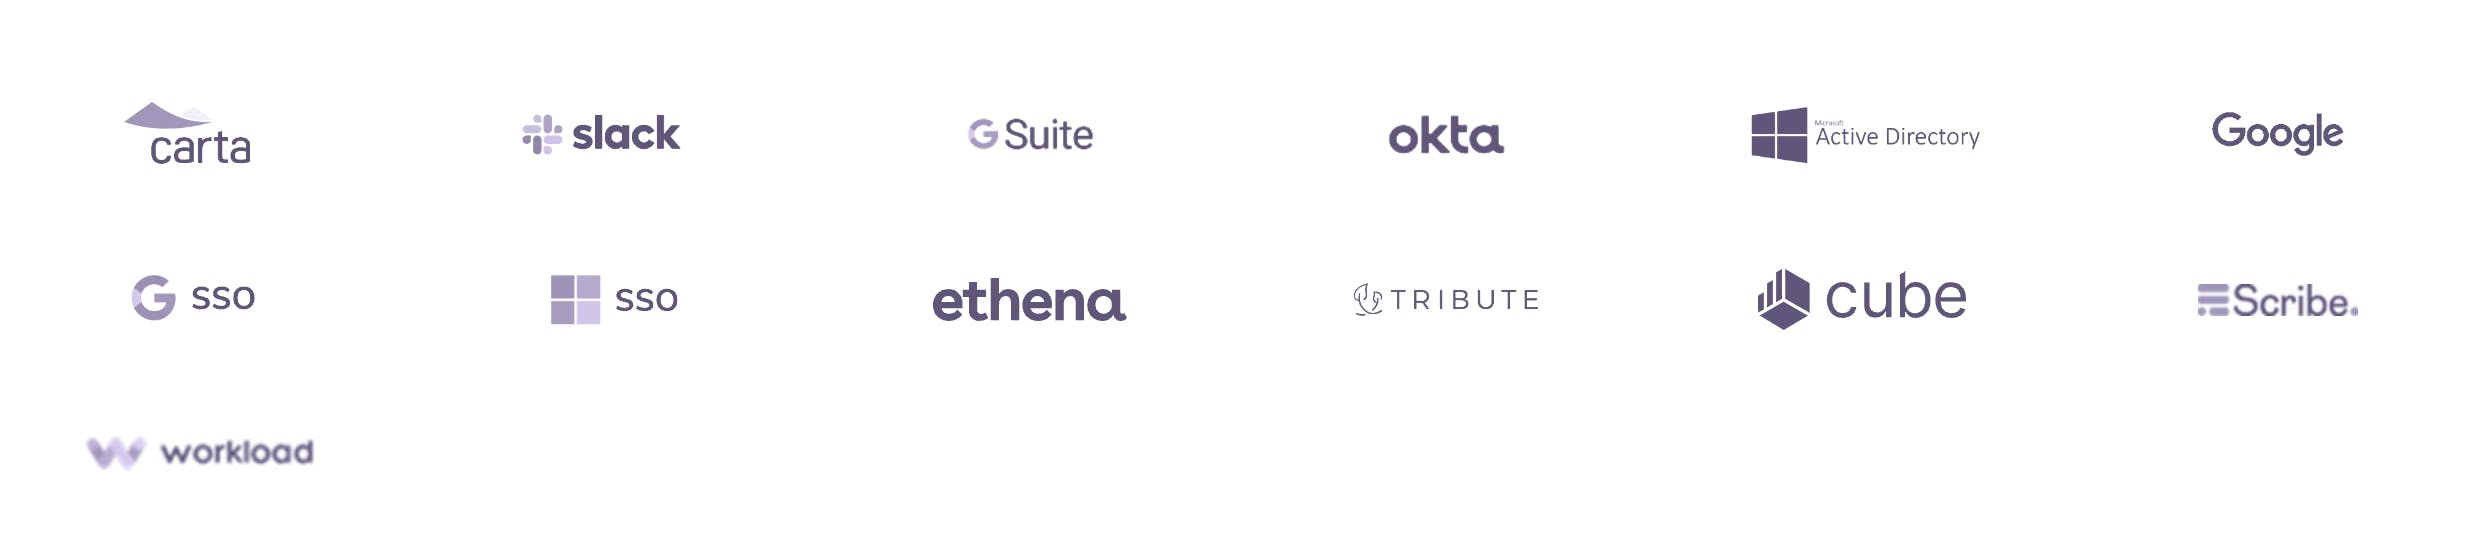
ChartHop allows users to integrate data from numerous other systems and apps into one unified platform, and can automatically update org charts, maps, reports, and even spreadsheets once the appropriate integration is set up. Notable integrations supported by ChartHop include BambooHR, Carta, Deel, Gusto, Lever, Workday, Zenefits, Slack, Okta, and Google.
Performance Reviews
Source: ChartHop
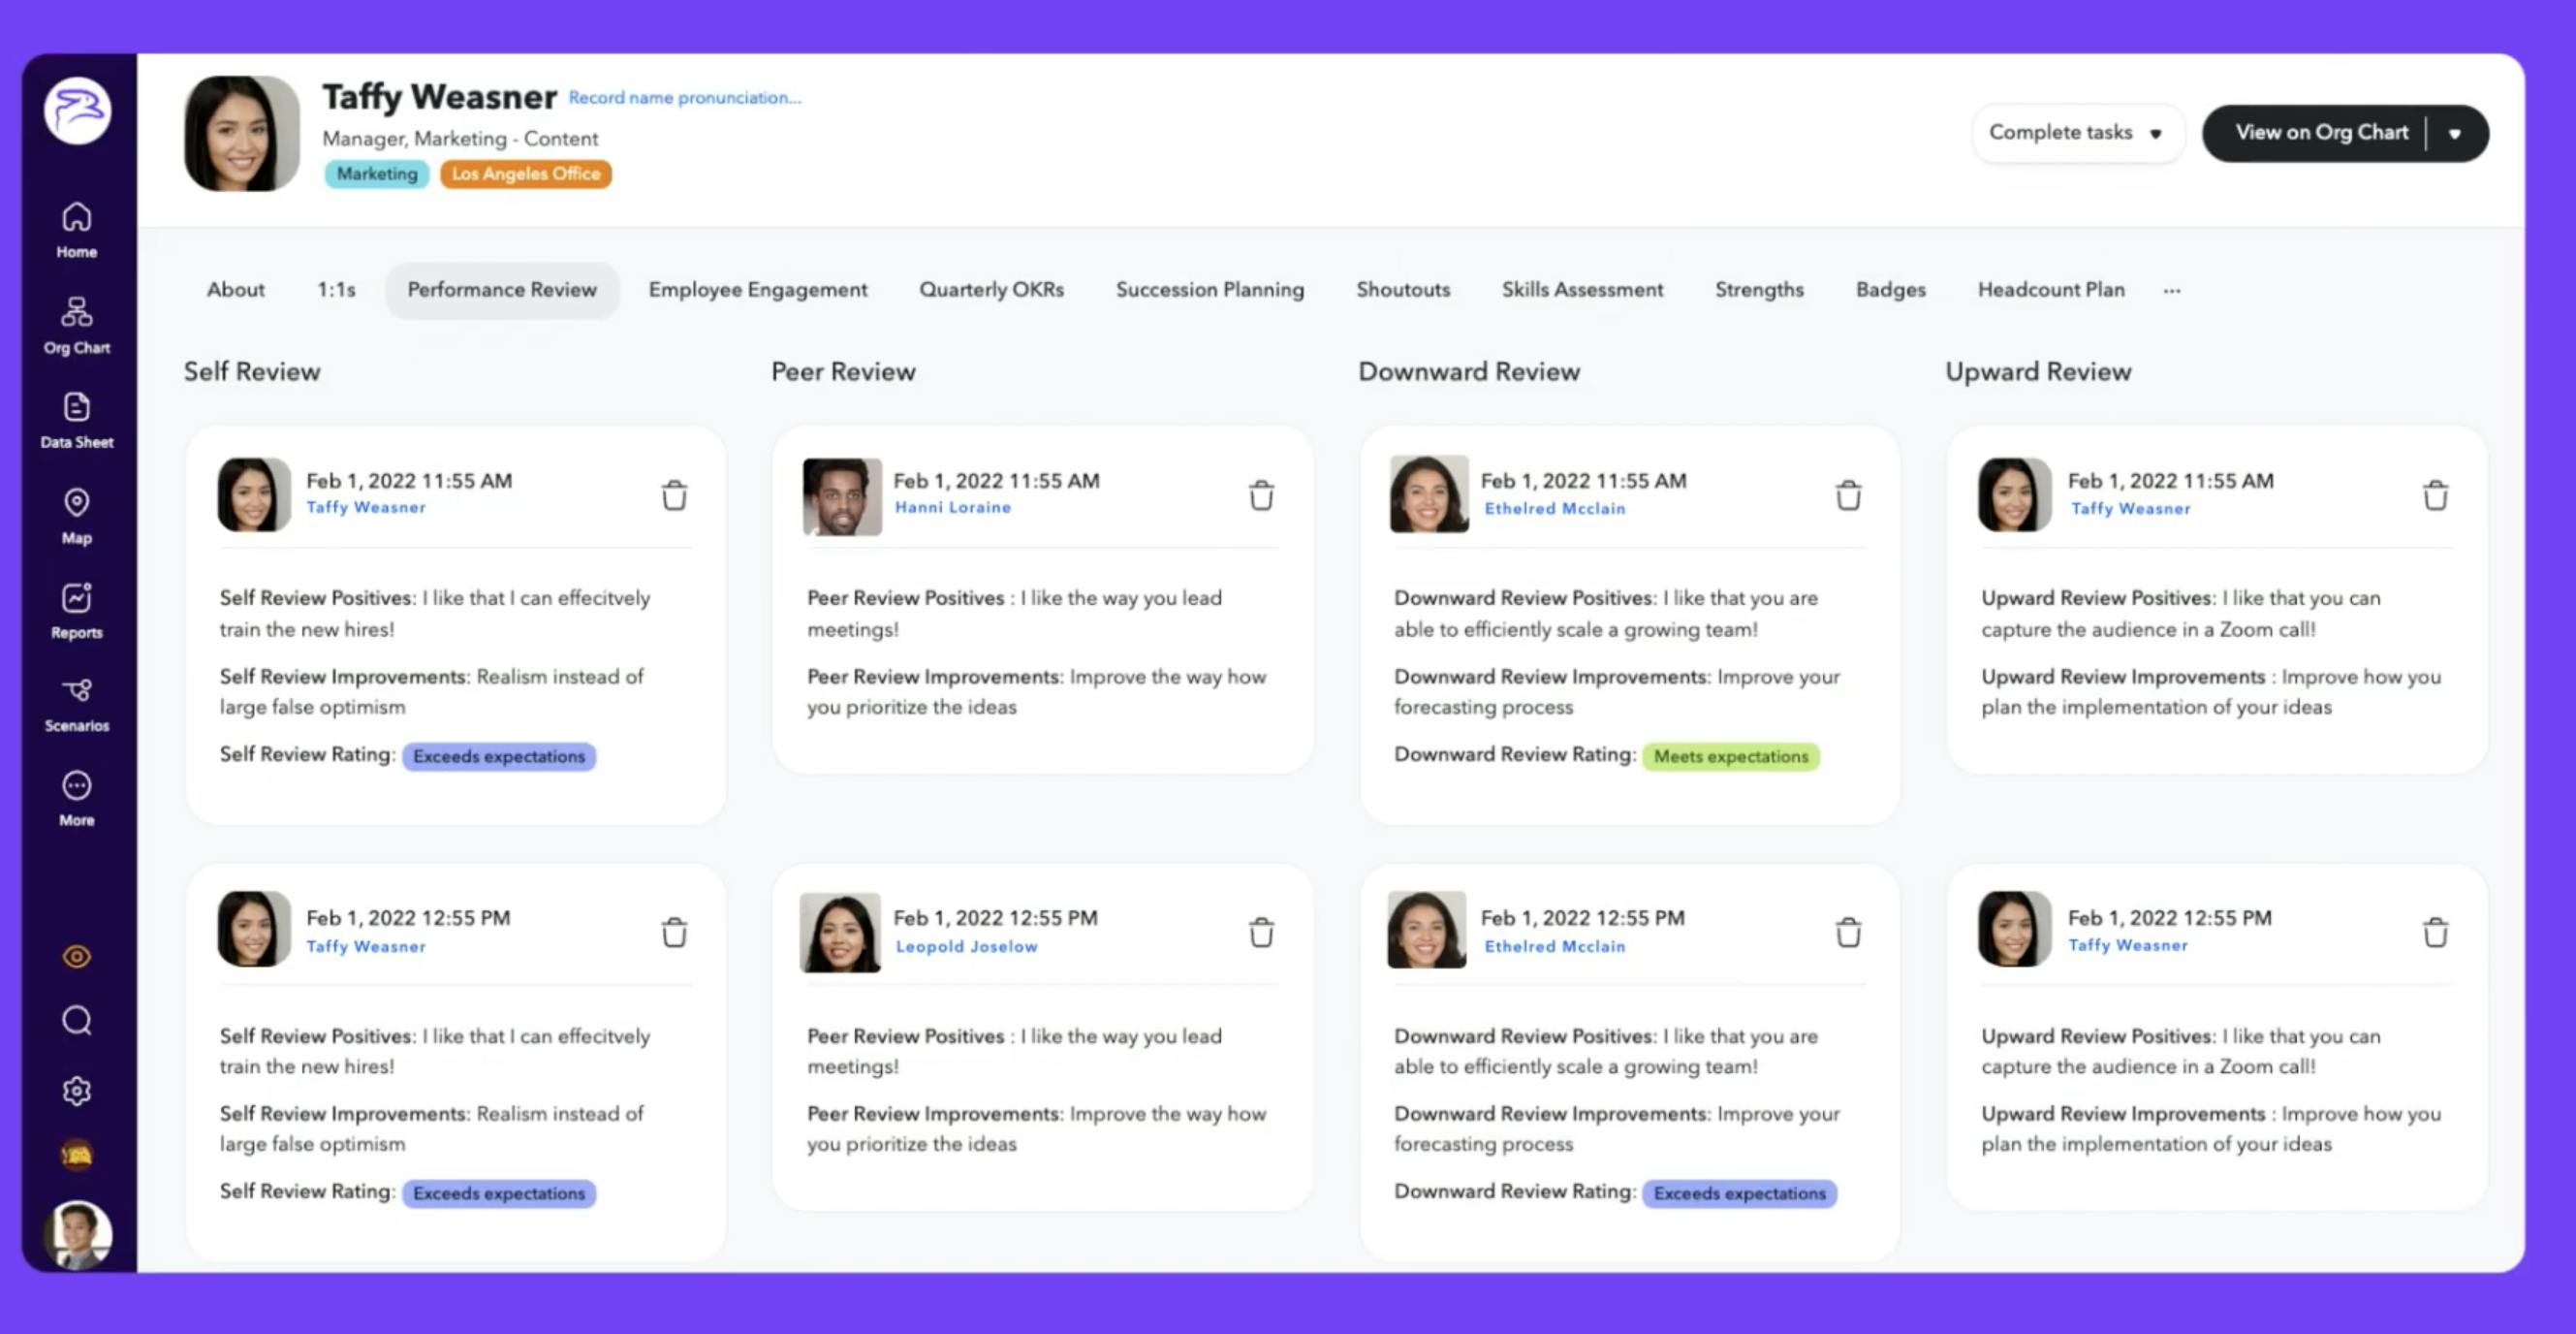
ChartHop’s Performance Reviews product is intended to simplify the performance review process by bringing performance reviews into the same platform as other people operations. Performance reviews can be viewed alongside performance data, and ChartHop records historical employee reviews in employee profiles. It also provides best practice templates and allows for automated reminders to complete performance reviews over Slack.
Recruiter Experience
Source: ChartHop
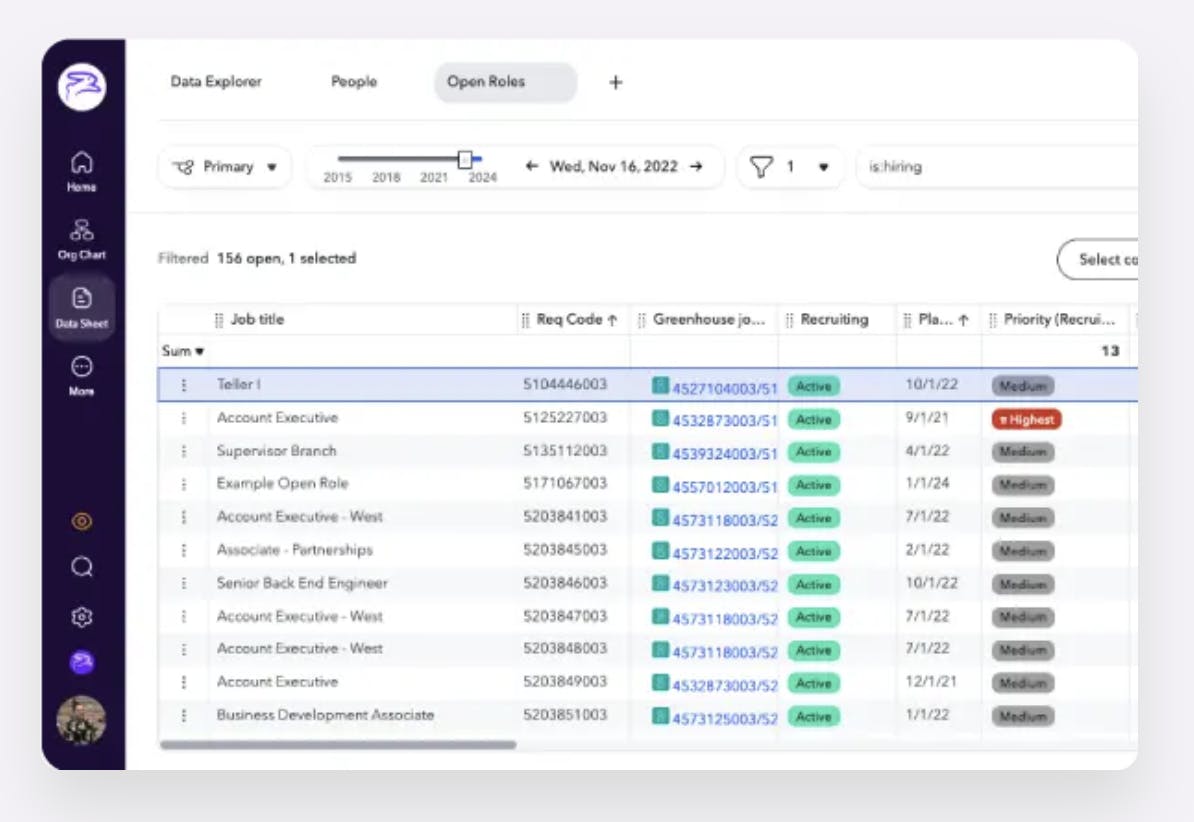
ChartHop’s Recruiter Experience product allows users to give recruiters they are working with access to headcount plans, new hire data, and other ATS data. The tool is intended to enable better collaboration between different teams like finance, operations, and the hiring manager, and allows companies to automatically update open jobs with new hire details.
Market
Customer
ChartHop is built to work for companies of any size, from early-stage startups to large corporations with thousands of employees. Some of its core products such as headcount planning are especially designed for fast-growing organizations, and many of ChartHop’s early customers were small, high-growth companies struggling to properly forecast how changes in headcount would impact their underlying business.
ChartHop’s platform also lends itself to remote organizations whose employee bases are scattered across multiple geographies. For example, ChartHop is used by MongoDB whose 4K+ employees operate in a hybrid work environment.
ChartHop’s CFO, Matt Wolf described the customer demographic that ChartHop is targeting as follows:
"We like to think that any company with people is a good candidate for ChartHop. There is a certain size at which organizational planning/compensation planning becomes more challenging, so really kind of above maybe 100, 150 people is where we start hitting our sweet spot, but we can go into the multiple thousands and beyond”.
Notable customers that ChartHop lists on its website as of February 2024 provide evidence of the diversity of organizations that it targets.
Source: ChartHop
Such customers include One Medical, Pepsi, Plaid, 1Password, PitchBook, and Mixpanel.
Market Size
Investor interest in HR tech has grown significantly in the 2020s. In 2021, venture capitalists invested over $12.3 billion into HR tech startups, ~3.5 times the amount invested in 2020. This increased investment continued into 2022, with over $1.4 billion being invested into HR software in the first two months alone. From January to June 2023, 15% of new billion-dollar startups in Europe were HR software companies, compared to 4% in all of 2022. As companies are still grappling with changing workforce dynamics and adapting to remote work, the market for HR software to facilitate this workplace shift will likely continue to grow.
The HR software market was valued at $9.6 billion in 2022 and was projected to grow at a 6.5% CAGR to reach $18.6 billion by 2032. While ChartHop operates across multiple segments within HR tech, from compensation management to employee engagement, its core product can be placed under the umbrella of “people analytics”, a segment that is projected to take up a large portion of the HR analytics market and was worth $2.5 billion in 2020.
One of the core drivers behind the growth in people analytics software is the need to embed data analytics into day-to-day HR processes. 70% of company executives surveyed by McKinsey in 2020 cited people analytics as a top priority.
Competition
Lattice: Lattice is a people management platform that specializes in performance management, employee engagement, and goal setting. Founded in 2015, Lattice has raised a total of $329.3 million as of February 2024, having raised a $175 million Series F round at a $3 billion valuation in January 2022. As of January 2024, Lattice was used by more than 5K businesses including notable companies like Slack, Gusto, Intercom, Ramp*, NPR, Calm, and Tide.
Similarly to ChartHop, Lattice provides organizations with tools to visualize their workforce through organizational charts and scenario modeling. However, while ChartHop primarily focuses on organizational planning and design, Lattice extends its reach into the realms of performance evaluation and employee development.
Visier: Visier is a people analytics and workforce management software that was founded in 2010. In June 2021, Visier raised a $125 million Series E at a $1 billion valuation which brought its total funding to $216.5 million. As of 2021, Visier processed employee records for 8K customers, including Adobe, BASF, Bridgestone, Electronic Arts, McKesson, Merck KGaA, and Uber. These companies collectively represented 12 million individual users across 75 countries for Visier.
Like ChartHop, Visier enables organizations to have a visual overview of their workforce and model the impact of future hiring scenarios. However, while ChartHop is largely focused on people operations (via organization charts), Visier also offers products such as Corporate Sustainability Reporting Directive (CSRD) reporting to ensure customers are compliant with regulations.
AgentNoon: AgentNoon is a workforce planning and organizational design software for global teams. Founded in 2021, AgentNoon raised $500K via YC’s W22 batch. AgentNoon integrates with 80+ data sources to let companies visualize and plan their organizational structure via org charts. It also enables teams to build operating models to estimate the cost of pursuing different organizational changes. In terms of pricing, AgentNoon doesn’t charge an implementation fee but instead charges $299/user/month. This contrasts with ChartHop, which charges $8/user/month but with a high initial implementation fee. AgentNoon describes the difference between both software platforms as follows:
“ChartHop lacks focus, attempting to cover a wide range of features without excelling in any specific area. This results in a diluted user experience and reduced efficiency. Agentnoon as a ChartHop alternative has a dedicated approach to org design and workforce planning.”
15Five: Founded in 2011, 15Five is a performance management tool that lets HR managers measure team engagement, performance, and retention. In July 2022, 15Five raised a $52 million Series C led by Quad Partners with additional funding from previous investors Next47, Origin Ventures, Edison Partners, Matrix Partners, Point Nine Capital, and New Ground Ventures.
As of 2022, 15Five is used by 3.4K companies, including Credit Karma, Spotify, and Pendo. Similar to ChartHop, It primarily targets businesses with between 100 and 2.5K employees. However, while ChartHop offers solutions for people leaders to create org chats and model scenarios, 15Five is mainly focused on talent & performance management solutions, such as OKR tracking and manager-employee feedback tools like 1-on-1s and pulse ratings.
Alongside these key competitors, there exists a plethora of companies competing with ChartHop in key areas, from employee engagement to headcount planning. Some examples include Team Ohana, Knoetic, EmployeeCycle, and Beamery.
Business Model
ChartHop offers four standalone modules that users can pick based on their needs. ChartHop Basic, which is free to try for teams under 150 employees, allows for the use of ChartHops Org Chart Product, Maps, several integrations, and a dashboard. Pricing for companies with greater than 150 employees, or that are looking to access ChartHop's full functionality, is not publicly disclosed and must be requested individually.
Traction
ChartHop grew from 30 employees to over 140 in 2021, and in 2022, it reached 190 employees. Its pace of hiring has since slowed, with CEO Ian White having stated that ChartHop had ~150 employees in a May 2023 interview. In terms of revenue and user growth, in January 2023, ChartHop announced that its revenue and number of active users had grown 4x since June 2021. Its number of paying customers also grew by 3x during that same period. ChartHop also ranked number 50 on the 2023 Inc. 5000 list and was named “among the best companies for remote workers” by Quartz in October 2023.
Valuation
In January 2023, ChartHop raised a $20 million Series C round led by Cox Enterprises with participation from Andreessen Horowitz, who also led all of ChartHop’s prior rounds. The round brought ChartHop’s total funding to $74.1 million. Although no press release disclosed a valuation, PitchBook placed its post-money valuation at $260.1 million.
ChartHop’s Series C round size was smaller than its Series B when it raised $35 million at a reported post-money valuation of $335 million in June 2021. This fall in round size and valuation may have been due to a wide-scale drop-off in tech valuations in the intervening period due to macroeconomic conditions. These conditions impacted HR tech startups significantly, with reduced hiring counteracting the need for HR software. For example, the number of firms that cut back their spending on HR software in 2023 increased from 5% to 8%.
CEO Ian White described ChartHop’s Series C round as follows:
“It’s no secret that this is a tough fundraising market. SaaS valuations are down, firms are reluctant to deploy capital, and many companies may be forced to raise capital on structured terms that can significantly impact employee equity. Ultimately, this round enables us to keep delivering the best product for our customers.”
Key Opportunities
Leveraging AI
With the recent advancements in AI, there are significant opportunities for HR technology companies to embed AI into their products. By leveraging AI, instead of relying on raw data analysis to derive insights, HR platforms can now enable people leaders to predict employee retention, recruitment, and learning outcomes with increased accuracy. Through this, team leaders can draw stronger insights from data, leading to more informed decision-making processes that benefit the overall performance of an organization.
Building Tools for The Global Workforce
As of June 2023, 12.7% of full-time employees worked from home, while 28.2% of employees had fully adapted to a hybrid work model. By 2025, an estimated 32.6 million Americans will be working remotely, which equates to around 22% of the workforce.
Given the continuing demand for flexible working environments, companies are being forced to adapt, requiring them to change their internal processes. However, the current tools companies have to manage their organization aren’t purpose-built for remote teams. This presents an opportunity for ChartHop to leverage its access to company-wide data and build new features that give people leaders increased insight into their internal structure. For example, ChartHop can enable companies to compare how productivity differs by region and compensation, allowing teams to focus hiring efforts on specific regions.
Key Risks
Data Security
As ChartHop has access to confidential company-wide data, security is of paramount importance. Given this, ChartHop must ensure that its data storage processes are secure to gain the trust of large organizations. This challenge is exacerbated by an increasing number of cyberattacks due to AI. For example, an August 2023 report revealed that 75% of security professionals had witnessed an increase in attacks over the preceding 12 months, with 85% attributing this rise to bad actors using generative AI. Thus, the changing landscape of cybersecurity attacks means that ChartHop must continue to invest in improved security practices to prevent the risk of data leaks.
Economic Downturn
In 2023, 25% of HR budgets decreased, compared to 12% in 2022. Further, 28% of leaders said their budgets have remained stagnant year over year, despite rising costs. As a result, HR budgets were shrinking, resulting in cost-cutting and the elimination of nice-to-have software. This poses a challenge for the entire people analytics industry, especially as the benefits of HR software are largely intangible. ChartHop will have to navigate a challenging business environment as it attempts to continue to grow.
Summary
In the early 2020s, the workforce has changed dramatically due to the rise of remote work, and the HR tools needed to support this shift have grown in both importance and demand. ChartHop is one of the many startups that have benefited from this shift, helping organizations unlock previously hidden insights by connecting disparate data sources. As a result, ChartHop has placed itself as a leader in the people operations space, helping pave a new category in HR focusing on people operations and management. However, with increasing layoffs and internal HR budgets falling in 2022 and 2023, people operations companies like ChartHop will be put under pressure to continue to grow without inordinately burning cash.
*Contrary is an investor in Ramp through one or more affiliates.