Thesis
Improvements in cloud computing and the COVID-19 pandemic have expedited the shift to the digital world. Since the pandemic, there has also been a shift to remote work and working from home: the number of people working from home tripled between 2019 and 2022. Small businesses are increasingly adopting digital services and expanding their online presence. This has led to the rapid expansion of the global SaaS (software-as-a-service) market. One study found that global SaaS grew by over 179% in 2022. The B2B SaaS market is projected to grow from $251.1 billion in 2022 to $883.3 billion by 2029.
As every company moves toward becoming a software company, they face challenges in creating and dispatching software and managing tech teams to drive business success. The tools they depend on to address this are often inadequate, subjective, and manual, providing static data that quickly becomes outdated. Leaders of engineering organizations often rely on intuition instead of metrics or processes when communicating the impact of their team's work and decisions, and engineering leaders increasingly want to embrace data-driven decisions and ensure engineering work is aligned with business objectives.
Jellyfish is an engineering management platform that helps engineering leaders align their teams' work with strategic business objectives. By analyzing engineering signals and contextual business data, Jellyfish provides visibility into engineering organizations, their work, and their operations. Jellyfish can help engineering teams communicate with each other to speed up development and with the business teams to explain where and how resources are being used.
Founding Story
Jellyfish was founded in 2017 by Andrew Lau (co-founder and CEO), Phil Braden (co-founder) and David Gourley (co-founder). Prior to founding Jellyfish, Gourley co-founded Endeca Technologies, Inc., a provider of unstructured data management, web commerce, and business intelligence solutions, which was bought by Oracle in 2011 for $1 billion. At Endeca, Braden was a member of the founding team and the first product manager; Lau was first hired as an intern and eventually became the VP of Engineering. Gourley later served as VP of Engineering at Groupon and co-authored a book on HTTP. Lau went on to become Chief Strategy Officer at ad tech company Nanigans.Braden had worked with several startups, including being a General Manager at Fishbowl Marketing.
On a night out at a sushi restaurant in downtown Boston, the trio discussed their vision for a new company: the team, culture, and B2B business model focusing on innovation and new markets. Comparing the situation to the pre-Salesforce CRM and Siebel Systems era of sales management, they wondered if they could transform engineering in the same way those systems revolutionized sales. As they bantered about engineering, they joked that no one wanted to run engineering teams because “that job sucks.” On reflection, this prompted them to ask what lay at the heart of the difficulty in managing engineer teams.
In doing so, they realized that every business function had gained visibility over the previous two decades to build a bridge between its operations and its purpose — other than engineering. The lack of understanding between engineering and business generated miscommunication, resulting in inefficiency and stress. All three co-founders had experienced such stress at past companies they’d worked for.
They decided to make a product that would help both executives understand what engineers were doing and help engineers understand how their actions translated to the business’s bottom line. During over 60 interviews with would-be customers, they found that executives struggled to drive productivity within their teams and effectively show the positive impact the team was having on the business. They created Jellyfish to help solve this problem: “We want to do for data engineering what Salesforce did for sales,” explained Lau.
After brainstorming a company name, the team chose Jellyfish as a placeholder from a list of plants and animals. They thought it was fitting because Jellyfish possess flexibility, dynamism, and transparency. Although they planned to change the name later, they kept it due to its popularity. Unlike other corporate names, Lau remarked that the name was unique and elicited fun reactions from people.
Product
Engineering Investment & Business Alignment
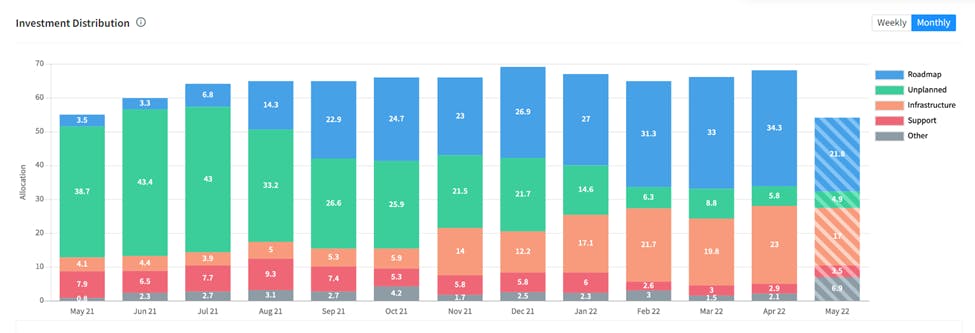
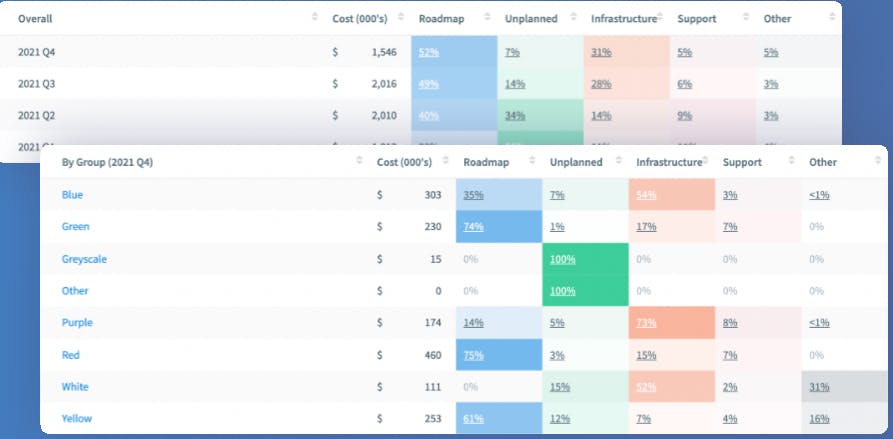
Jellyfish’s strategic alignment dashboard shows how much time engineers spend on various monthly activities and how that work aligns with the company’s business initiatives. For example, leaders tracking the dashboard might realize that their teams spend most of their time on “unplanned” activities. This insight could cause leaders to strategize with their teams about how to spend their time better.
The dashboard also provides a section to track “unused FTEs” (full-time employees). This allows leaders to ensure that all engineers are adequately used and allocated to projects rather than sitting idle. The dashboard can enable leaders to ensure that their engineers utilize their time well and don’t sit idle. For example, in the dashboard image below, the blue represents “Roadmap” activities, while the green represents “unplanned” activities.
Source: Jellyfish
Engineering & Product Operations
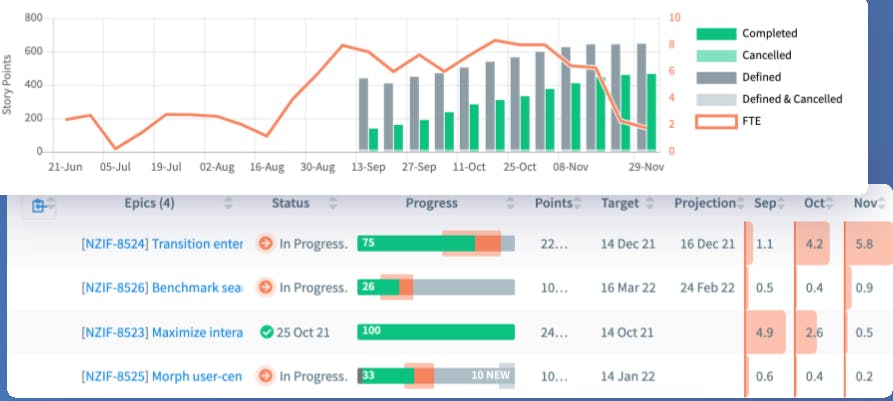
Jellyfish’s Engineering & Product Operations dashboard aims to help executives measure and improve the operations of the engineering organization, from structure and resource allocation to processes and tools. Users can gain visibility into the progress or roadblocks of initiatives and deliverables to ensure teams can ship on schedule. Users can measure the efficiency of a team’s operations and understand how it is doing compared to the metrics that matter most to the organization.
Source: Jellyfish
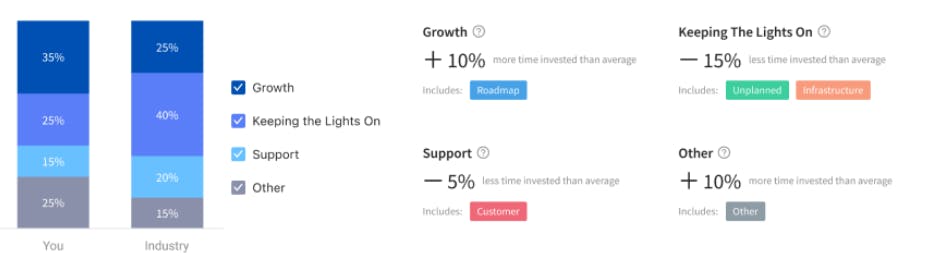
The Engineering Optimization dashboard also allows executives to benchmark their company’s operations against industry standards. Benchmarking can help executives and engineers understand whether their company is working on more or fewer growth-related activities than an industry standard.
Source: Jellyfish
Team Health
Jellyfish’s Health dashboards enables different teams to communicate. One of the dashboards, for example, measures how people interact across applications like Jira and Github.
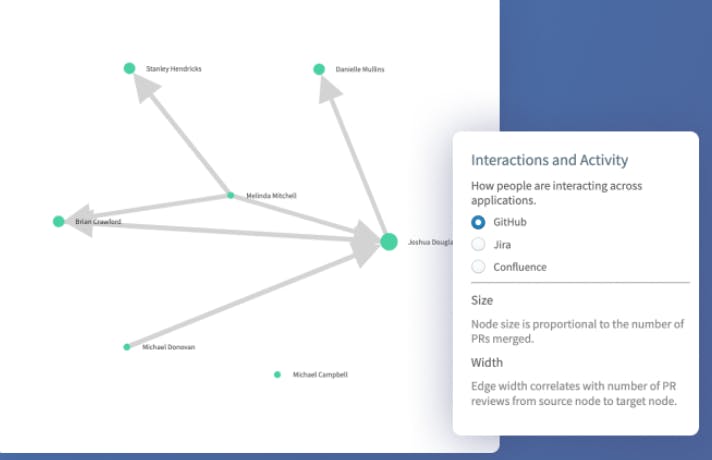
Source: Jellyfish
R&D Cost Capitalization
Jellyfish helps automatically report on product development efforts for finance in an auditable way. It allows users to aggregate and report on capitalizable efforts with automated categorization and tracking of capitalizable software development efforts. This allows users to understand where their employees’ time is going and how that time spent may impact the company’s bottom line. By capitalizing software costs, companies can avoid paying the full cost of R&D up front – instead, they can amortize the cost over time.
Source: Jellyfish
DevOps Metrics
Jellyfish’s DevOps metrics dashboard includes tracking of deployment frequency, mean time to resolution, incident rate, and lead time to production. Jellyfish automatically ingests and analyzes signals from continuous integration, incident management, issue tracking, and other DevOps tools.
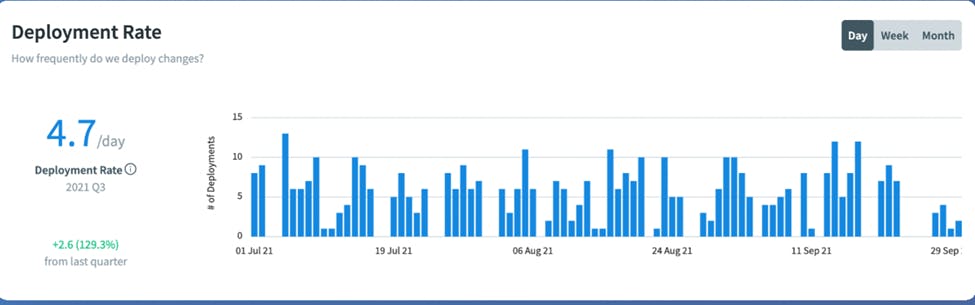
Source: Jellyfish
The Jellyfish DevOps dashboard also enables users to understand when failures occurred, allowing companies to be better equipped to address such failures in the future.
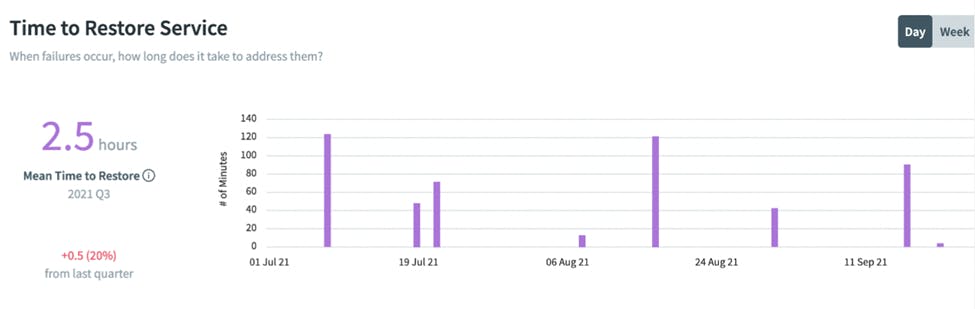
Source: Jellyfish
The platform can measure the status of deliverables – what deliverables were completed, what deliverables are in progress, and where in the pipeline those deliverables are. The platform also contains a section devoted to “best practices”, reminding users of engineering best practices.
Jellyfish DevFinOps
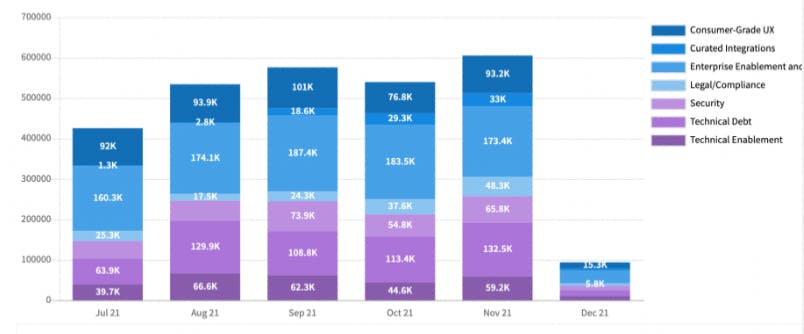
Jellyfish seeks to simplify and automate reporting and financial workflows of software development efforts and facilities cross-functional operations between development, finance, and operations teams. It enables executives to make strategic decisions by giving them access to information about how much of the company’s resources were spent on revenue-generating activities versus costly activities. By tracking how much time each engineer spend on various activities in each quarter, Jellyfish’s dashboards make it easier for executives to identify financial planning insights.
Source: Jellyfish
Scenario Planning
Jellyfish’s Scenario Planning tool helps executives understand the tradeoff between moving engineers from one project to another. This helps team leaders plan how to allocate resources and save project timelines by understanding the risk profile involved when juggling engineering resources across deliverables.
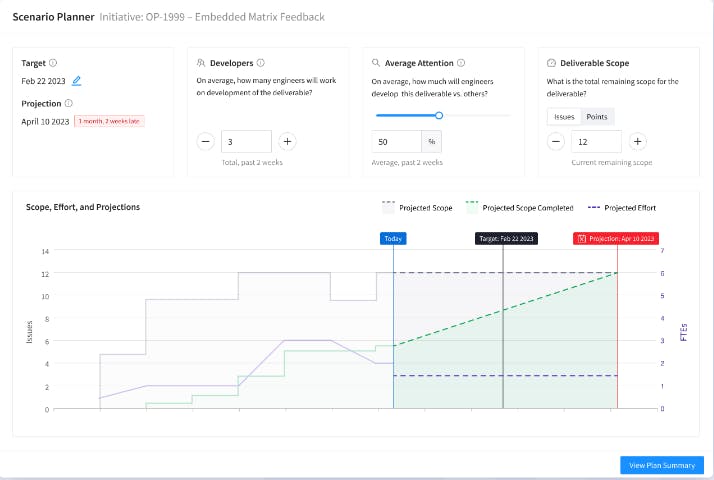
Source: Jellyfish
The scenario planning tool can also help team leaders communicate tradeoffs to other organization members. Rather than make allocation or staffing decisions based on intuition, it allows team leaders to understand and communicate their decisions or needs to executives based on data, not subjective opinions.
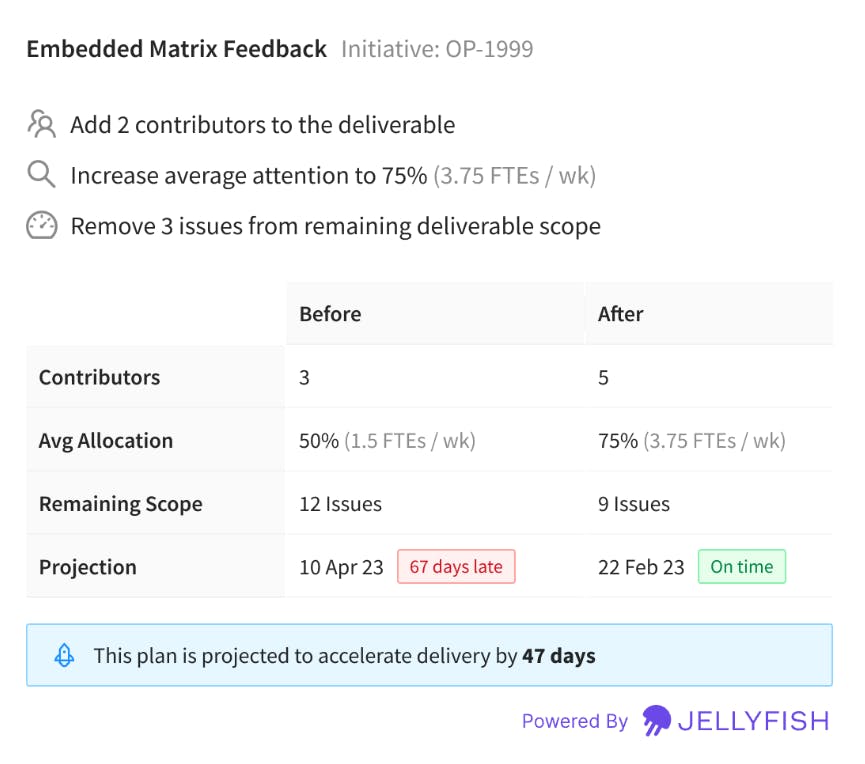
Source: Jellyfish
Market
Customer
Jellyfish serves the software engineering function in companies focusing on developing software and using tools like Jira, GitHub, Google Sheets, Slack, GitLab, and Confluence. It is used by engineering managers, engineering teams, finance teams, and product leaders.
Its customers include companies such as Mastercard, Priceline, ZoomInfo and PagerDuty, which all use Jellyfish to optimize the allocation of engineering resources to focus their teams on what matters most to the business.
Market Size
The global engineering software market was $32.6 billion in 2022 and is expected to reach $50.2 billion by 2026, representing a CAGR of 9.7%. A 2023 survey of US software developers revealed that CTOs lack visibility into their teams' progress and have difficulty communicating engineering goals to others in the organization. Many rely on intuition when making decisions and assessing impact.
CTOs aren’t always aware of what engineering teams are working on. 33% of software developers feel that most engineering challenges go unnoticed by higher-ups, reflecting a lack of visibility and misalignment between engineering and leadership. Almost all developers reported a negative impact when they were unaware of the projects being worked on by their leadership team.
Competition
LinearB: Like Jellyfish, LinearB provides a platform for software development organizations and helps track engineering work. The dashboard includes metrics that allow users to track how much time is spent coding, how much time review cycles take, and how much time deployment takes, among other metrics. Like Jellyfish, it helps measure the health and impact of engineering teams, drive efficiency with programmable workflows, and align R&D spend to the business's priorities. LinearB supports a freemium pricing model. The company served 1.5K development teams in 2021 and grew to 5K by May 2022. It is unclear, however, how many of those new customers are also paying customers. Customers include Bumble, BigID, Cloudinary, Unbabel and Drata. LinearB was founded in 2018 and has raised $70.6 million in funding.
Swarmia: Swarmia is an engineering productivity platform that gives engineering leaders, managers, and teams the insights they need to see what’s slowing them down and the tools to resolve those blockers. The core functionalities of Swarmia’s product seem similar to Jellyfish’s. Swarmia was founded in 2019. Swarmia contains a Work Log dashboard, allowing users to track what they’re working on and where each piece of work is in the pipeline. Swarmia also allows users to view specific metrics, cycle time, and how frequently software is deployed. Like Jellyfish, Swarmia draws data from third-party platforms like GitHub, Slack, and Jira.
Jellyfish and Swarmia’s target markets and pricing, however, are different. Whereas Jellyfish’s product is aimed at software engineers, Swarmia’s is aimed at software developers (software developers typically work on specific aspects of the software, while engineers have a broader scope of responsibilities). In terms of pricing, Swarmia is free for companies with under 14 users, and costs $20 per user per month for companies with 15-500 employees. Companies with over 500 employees must pay $39 per user per month.
PluralSight: Pluralsight was founded in 2004 and acquired by Vista Equity Partners in 2020. Pluralsight started as an online training company that helps educate IT professionals, including developers, with a suite of online courses. Pluralsight’s Flow offering is an engineering management dashboard designed for teams of engineers who, like Jellyfish’s users, want to identify actionable insights. The product was launched as a rebrand of GitPrime, which PluralSight acquired for $170 million in 2019. Flow seeks to provide “actionable, leading indicators” – in other words, to use data from the past to predict future trends and enable engineering teams to improve. The platform allows engineers to benchmark DevOps metrics such as “deployment frequency,” “lead time for changes”, and “time to restore service”. Unlike Jellyfish and Swarmia, Flow does not have a freemium tier. Instead, customers have to pay for the Core or the Plus subscription.
Uplevel: Uplevel is another company that gives a data-driven look into engineering efforts and their impact on team health. It was founded in 2018 and has raised $34 million in funding. Its revenue doubled in 2021. Customers include Qualtrics, Nutanix and Twilio. Uplevel measures and aggregates “operational metrics” and “people health.” Operational metrics tracks the time engineers spend on a project or deploying code, and its “people health” offering shows how often developers are pausing deep work to do other tasks like answer messages.
Business Model
Jellyfish charges on a subscription basis. Jellyfish’s prices are not posted on its website, so it is difficult to tell whether its prices are in line with those of competitors.
Traction
In 2020, Jellyfish quintupled its revenue. In 2021, it more than tripled its revenue, with hundreds of new customers like Priceline and PagerDuty. In 2023, Jellyfish was named one of the companies on the Intelligent Apps 40 list, which tracks the top private companies deemed to “shape the future.” In May 2023, it announced the platform was available on AWS Marketplace.
Valuation
As of June 2023, Jellyfish has raised $114.5 million in funding at an undisclosed valuation. It’s latest round of funding was $71 million Series C led by Accel, Insight Partners, and Tiger Global. Its revenue is also undisclosed.
Key Opportunities
Expanding into a Greenfield Market
“Greenfield markets” are markets that have never been fully commercially exploited. Because the market for productivity software — especially engineering management software — is relatively new, this may present a greenfield opportunity for Jellyfish. As more and more businesses move online, the total potential size of the software market expands. As companies increasingly view DevOps as an important goal, they may seek to adopt products such as Jellyfish.
Growing Demand for Engineering Management Software
The demand for engineering management software is growing due to the increasing complexity of software development and increased digital penetration of the economy. As software systems become more complex and scale out, it becomes more difficult for engineering teams to manage their work effectively. Engineering management software can help engineering teams to track their progress, identify and resolve issues, and ensure that they are meeting their deadlines.
Key Risks
Economic Downturn
Jellyfish’s main target audience — startups — may be hit especially hard in an economic downturn. Given that the current funding environment (as of June 2023) may make it difficult for new startups to emerge, Jellyfish may experience a slowdown in growth as the pool of potential customers begins to shrink. And even if customers value Jellyfish’s product, it may be difficult to retain customers for long periods if many of those customers end up going out of business during a downturn.
Reliance on Third-Party Platforms
As of May 2023, Jellyfish relies on third party platforms like Jira to track engineers’ time. Jellyfish could start seeing competition from the underlying platforms or face constraints in product development due to platform constraints. Jellyfish's reliance on third-party platforms could pose a risk to the company. If the underlying platforms start to offer their own engineering management software or if Jellyfish faces constraints in product development due to platform constraints, Jellyfish could lose customers or be unable to compete with other providers.
Insufficient Differentiation
Jellyfish’s platform, on the surface, appears similar to that of its competitors such as Pluralsight Flow and Swarmia. All three products have dashboards that appear user-friendly. All three connect to other underlying platforms, such as Jira to perform core functionalities like tracking engineers’ time.
Summary
Jellyfish is an engineering management platform that helps align teams' work with business objectives. It analyzes engineering signals and business data, providing visibility into organizations and facilitating effective communication and collaboration. With features like strategic alignment, operations, team health, and metrics, it serves software engineering functions and is used by various teams. Jellyfish benefits from the growing SaaS market but may face challenges with pricing and reliance on platforms like Jira. Profitability and valuation are yet to be determined.